


| Original Article | ||
Open Vet J. 2023; 13(2): 150-170 Open Veterinary Journal, (2023), Vol. 13(2): 150–170 Original Research Long-term histological effects of high-dose prednisolone administration on the mitral valve in normal Beagle dogsSachiyo Tanaka1*, Shuji Suzuki1, Misaki Shimura1, Asaka Kawana2, Aki Tanaka3, Satoshi Soeta4 and Yasushi Hara11Division of Veterinary Surgery, Department of Veterinary Science, Faculty of Veterinary Medicine, Nippon Veterinary and Life Science University, Tokyo, Japan 2Tokyo University of Agriculture and Technology Animal Medical Center, Tokyo, Japan 3Division of Wildlife Medicine, Department of Veterinary Science, Faculty of Veterinary Medicine, Nippon Veterinary and Life Science University, Tokyo, Japan 4Division of Veterinary Anatomy, Department of Veterinary Science, Faculty of Veterinary Medicine, Nippon Veterinary and Life Science University, Tokyo, Japan *Corresponding Author: Sachiyo Tanaka. Division of Veterinary Surgery, Department of Veterinary Science, Faculty of Veterinary Medicine, Nippon Veterinary and Life Science University, Tokyo, Japan. Email: sachiyoct [at] gmail.com Submitted: 25/07/2022 Accepted: 10/01/2023 Published: 07/02/2023 © 2023 Open Veterinary Journal
AbstractBackground: In recent years, left ventricular hypertrophy and cardiac dysfunction have been reported in human and canine patients with hypercortisolism and in dogs treated experimentally with high-dose prednisolone. However, to our knowledge, there have been no reports on the effects of hyperglucocorticism (HGC) on the mitral valve (MV). Aim: This study aimed to compare the MV in dogs treated with high-dose prednisolone with that in healthy dogs to investigate the effects of HGC on the MV. Methods: We investigated the effects of HGC on the MV by comparing samples obtained from high-dose glucocorticoid (GC)-treated (P) and healthy (C) dogs. The P group included healthy Beagle dogs (n=6) treated with prednisolone (2 mg/kg, bid, po) for 84 days and the C group included healthy Beagle dogs (n=6) euthanized for unrelated reasons. The anterior and posterior mitral leaflets (AML and PML, respectively) from both groups were harvested and stained with hematoxylin–eosin, Alcian blue, and Masson trichome. Additionally, adiponectin (ADN) and GC receptor immunohistochemistry were performed. Histological evaluation was performed in the atrialis, spongiosa, fibrosa, and all layers of the proximal, middle, and distal regions of the AML and PML. Results: The proportion of the spongiosa layer thickness to the total thickness was higher in the P than in the C group (proximal and middle AML). However, the proportion of the fibrosa layer thickness to the total thickness was lower in the P than in the C group (middle PML). Areas of acidic sulfated mucosubstance deposition were smaller in the fibrosa layer and all layers (middle AML), while those of collagen deposition were smaller in the spongiosa and total layers (proximal and middle AML), in the P than in the C group. Additionally, ADN expression in the spongiosa layer was higher in the P than in the C group (middle AML). Conclusion: These findings suggest that long-term administration of synthetic GCs induces histological changes in the MV. These changes may lead to MV dysfunction in dogs with HGC. Keywords: Anterior mitral leaflet, Canine, Cushing syndrome, Hyperglucocorticism, Posterior mitral leaflet. IntroductionThe incidence of canine Cushing's syndrome (CS) has been estimated to be 0.2%, rendering it the most common endocrine disease (de Bruin et al., 2009; Carotenuto et al., 2019). Hypercortisolism (HAC) is one of the causes of CS (Boscaro et al., 2001; Behrend et al., 2013; Nieman, 2015; Nivy et al., 2018). Cardiovascular complications, such as stroke, myocardial infarction, and pulmonary embolism, in human patients with HAC, are associated with mortality rates four times higher than those in the healthy population, indicating that the systemic changes associated with hyperglucocorticism (HGC) increase cardiovascular risk (Boscaro et al., 2001; van der Pas et al., 2013; Nieman, 2015). Furthermore, myocardial hypertrophy and cardiac diastolic and systolic dysfunction have been reported to occur due to morphological and functional changes in the heart, as specific cardiovascular changes in human patients with HAC (Sugihara et al., 1992; Isidori et al., 2015). Specifically, hypertrophy of cardiomyocytes and an increase in the cardiac fiber count were reported as histopathological changes (Sugihara et al., 1992). Recently, left ventricular hypertrophy and cardiac dysfunction had been reported in dogs with HAC and in those experimentally treated with high-dose prednisolone (Chen et al., 2014; Oui et al., 2015; Takano et al., 2015; Tanaka et al., 2021). A histopathological study of dogs showed no apparent change in the myocardium when a 2 mg/kg prednisolone dose was administered every 12 hours for 28 days (Oui et al., 2015). However, our recent study revealed that the same dose of prednisolone administered for 84 days caused fibrosis of the left ventricular myocardium and ventricular septum (Tanaka et al., 2021). In addition, it has been reported that left ventricular hypertrophy and cardiac dysfunction in human and canine CS cases are influenced by disease persistence (Fallo et al., 1994; Muiesan et al., 2003). Prednisolone is an orally administered synthetic glucocorticoid (GC) preparation, with an intermediate action duration of 12–36 hours, and is commonly used in small animal veterinary medicine for inflammation, allergies, immune-mediated diseases, and neoplastic diseases (Feldman and Nelson, 2003). Long-term administration of synthetic GC preparations, such as prednisolone, is known to cause iatrogenic CS, with clinical findings that are very similar to spontaneous HAC (Komiyama et al., 1991). Proper leaflet function relies on the microstructural components of the tissues of the heart valve leaflet. These consist of collagen fibers, elastin fibers, proteoglycans, glycosaminoglycans (GAGs), and valvular interstitial cells (Lovekamp et al., 2006; Ross et al., 2019). Specifically, a recent study in pigs reported that GAGs are responsible for regulating extensibility and stress decay in atrioventricular heart valves (Ross et al., 2019). In addition, a study focusing on the mitral valve (MV) in sheep reported that the density of collagen fibers may be related to the stiffness and stress level of the MV (Kunzelman et al., 1998). MV disease is the most common cardiac disease in dogs (Terzo et al., 2009). To our knowledge, there have been no reports on the effects of HGC on the MV. This study aimed to compare the MV in dogs treated with high-dose prednisolone with that in healthy dogs, to investigate the effects of HGC on the MV. Materials and MethodsDogsTwelve healthy male Beagles were included in this study. The six dogs that were included in the high-dose prednisolone (P) group (body weight: 9.5–11.2 kg, median body weight: 10.8 kg, age: 15–17 months, median age: 16 months) received 2 mg/kg of synthetic corticosteroid (5 mg prednisolone tablet YD; Yoshindo Co., Ltd., Toyama, Japan) orally every 12 hours for 84 days. The clinical parameters of the P group included physical examination findings, complete blood count, blood biochemistry, electrocardiography, non-invasive blood pressure measurement, and cardiac echocardiography findings at baseline (day 0) and at 7, 28, 56, and 84 days after the initiation of synthetic corticosteroid. On day 0 examination, all six dogs in the P group were carefully evaluated to ensure that 1) they were healthy, 2) they were not present with test results outside the normal range, 3) did not show any evidence of systemic disease, and 4) did not show any congenital abnormalities of the heart or cardiac disease. At each examination time-point after the initiation of medication, the general condition of the dogs was checked to ensure that they were well enough to continue the experiment, and changes over time were evaluated (Tanaka et al., 2021). In addition, in the P group, tetracosactide (0.25 mg cortrosyn injection; Daiichi Sankyo Co., Ltd., Tokyo, Japan) was administered intramuscularly on day 0 and on day 84 (125 μg for dogs weighing less than 5 kg and 250 μg for dogs weighing more than 5 kg), and blood samples were obtained at baseline and at 1 hour after injection for adrenocorticotropic hormone (ACTH) stimulation tests (Nivy et al., 2018). Serum cortisol concentrations were measured using the chemiluminescence enzyme immunoassay method (Fuji Film, Monolith, Tokyo, Japan). At the end of the treatment period, the dogs were euthanized by administration of pentobarbital (Kyoritsu Seiyaku, Tokyo, Japan; 90 mg/kg, iv) for histopathological examination. The control (C) group consisted of six dogs (body weight: 8.5–10.5 kg, median body weight: 9.6 kg, age: 8–19 months, median age: 17.5 months), which were euthanized using a similar procedure but for other purposes (anatomy and surgical training of veterinary students). The dogs in group C underwent a preliminary physical examination, electrocardiography, and non-invasive blood pressure measurement to confirm that there were no abnormalities or values outside of the reference range. The dogs in both groups P and C were housed in cages (0.7 m wide × 1.2 m deep × 1.5 m high). The temperature was 23°C, humidity was 50%–60%, and light and dark hours were from 6:00 am to 8:00 pm and from 8:00 pm to 6:00 am, respectively. The dogs were kept in the cage for the duration of the experiment but could roam freely indoors for 1 hour twice daily (morning and evening). In addition, we assessed the dogs in group P every 12 hours at the time of prednisolone administration to ensure that they had no energy- or appetite-related issues, were drinking enough water, and had no gastrointestinal symptoms or injuries. Histological preparationAfter euthanasia, the anterior mitral leaflet (AML) and posterior mitral leaflet (PML) of the MV were rapidly (within approximately 10 minutes) harvested from the hearts of the dogs in both groups. Subsequently, the valve was fixed to a thick paper backing using a 4–0 nylon thread with a needle to fix the valve as much as possible without curvature, and the edges of the valve, placed as far away from the center of the proximal and distal ends as possible, were fixed at four points: two points on the insertion site and two points on the free-end side. Afterward, the samples were immersed in 4% paraformaldehyde (PFA) in 0.1 M phosphate buffer (pH 7.4). These processes were performed within 30 minutes after euthanasia in all dogs. Then, the MV leaflets were immersed in PFA for 24 hours at 4°C and fixed. After dividing the MV into two parts at a mid-plain, parallel to the direction of the free end from the attachment, the tissue specimens were embedded in paraffin as usual. Then, the sections were prepared at a thickness of 5 μm. Hematoxylin–eosin (HE) staining was performed to measure layer thickness, cell counts in each layer (atrialis, spongiosa, and fibrosa layers), and the total layers, at each site (proximal, middle, and distal). Alcian blue (AB) staining was performed to evaluate GAGs density, and Masson’s trichrome (MT) staining was performed to evaluate collagen deposition, according to standard methods (Han et al., 2010; Tanaka et al., 2021). Specifically, HE staining was performed as follows. The slides were deparaffinized, rinsed in tap and ultrapure water, and stained in hematoxylin solution for 5 minutes. Then, they were rinsed in tap and ultrapure water and stained in eosin solution for 5 minutes. AB staining was performed as follows. The slides were deparaffinized, rinsed in ultrapure water and 3% acetic acid water (AAW), and stained with AB (pH 2.5) for 30 minutes. Then, they were rinsed with 3% AAW, tap water, and ultrapure water and stained with Kernechtrot for 3 minutes. MT staining was performed as described below. The slides were deparaffinized, rinsed in tap and ultrapure water, and stained in a mixture made from an equal amount of 10% potassium dichromate and 10% trichloroacetic acid for 20 minutes. Then, they were rinsed in tap and ultrapure water for 5 minutes each, stained in 0.75% orange G solution for 1 minute, and rinsed with 1% AAW. Then, the slides were stained in ponceau solution for 20 minutes and rinsed with 1% AAW. Subsequently, they were stained in 2.5% phosphotungstic acid for 10 minutes, rinsed with 1% AAW, stained in aniline blue for 10 minutes, and rinsed again with 1% AAW. Immunohistochemical stainAfter deparaffinization, tissue sections were immersed in 1% H2O2 for 30 minutes to block endogenous peroxidase activity. The cells were washed with 0.01 M phosphate-buffered saline (PBS). To activate the target antigens, sections for anti-adiponectin (ADN) and anti-GC receptor (GCR) immunohistochemical stains were subjected to microwave treatment at 500 W power for 15 minutes. Then, the sections were cooled to room temperature and washed with PBS. Subsequently, the sections were treated with 10% normal goat serum (Nichirei Bioscience, Tokyo, Japan) and anti-GCR immunohistochemical stain sections were treated with 0.01% normal goat serum (Nichirei Bioscience) for 30 minutes. Then, anti-ADN immunohistochemical stain sections were treated with anti-rabbit ADN polyclonal antibody (1:100) (ab47852; Abcam, Cambridge, UK), and anti-GCR immunohistochemical stain sections were incubated with GCR alpha antibody (1:50) (ab3580; Abcam) overnight at room temperature. Sections were washed with PBS and, then, incubated with anti-rabbit immunoglobulin peroxidase-conjugated antibody (Simple Stain Rat MAX-PO [MULTI]; Nichirei Bioscience) for 1 hour at room temperature. The sections were subsequently washed with PBS again, stained with 3,3'-diaminobenzidine chromogen solution (Histofine DAB Substrate Kit; Nichirei Bioscience), and counterstained with hematoxylin. Histological and immunological evaluationFor all staining methods, the area from the valve attachment to its free end was divided into three equal parts, and images were taken using a digital microscope camera (DP74; Olympus, Tokyo, Japan) in ×200 fields of view. The three sections were designated as proximal, middle, and distal (Markby et al., 2017). The proximal myocardium was excluded from all measurements and assessments. For HE staining, the thickness (μm) of the atrialis, spongiosa, fibrosa, and total layers was measured at each of the three sites using image analysis software (ImageJ, version 1.43u; National Institutes of Health, Bethesda, ML) (Fig. 1), and the average of three measurements was calculated to obtain the measured values. Concerning the details of the thickness measurement method in the image analysis software, the length and unit of the scale bar were inputted to obtain the actual length of the line, and the thickness of each layer was measured. The percentage (%) thickness of the atrialis, spongiosa, and fibrosa layers to the total thickness was calculated, and the number of cells in each layer was counted visually at each of the three sites. For AB and MT staining, the percentage of positively stained areas in the atrialis, spongiosa, fibrosa, and total layers in one field of view was calculated using the same image analysis software. Specifically, to calculate the percentage of positive-stained areas in ImageJ, we cleared the areas other than the target areas (e.g., the spongiosa, total layers), selected the target colors, and separated them. After confirming that the selected color area matched the actual image, the percentage of the selected color area in the target area was calculated. In the ADN immunohistochemical staining, the areas consisting of ADN-positive adipocyte cytoplasm in the spongiosa layer were measured and the percentages of ADN-positive areas in the spongiosa layer areas were calculated using the same image analysis software. For the GCR immunohistochemical staining, we assessed the MV region, in which the GCR was expressed. In addition, the percentage of the GCR-positive nuclei in the atrialis, spongiosa, fibrosa, and total layers in one field of view was calculated. All tissue sections were evaluated by two authors (S.T., M.S.), who were blinded to group classification during the imaging and evaluation of histological sections. Statistical analysisWeight (kg), age (months), and other continuous variables, such as the thickness of each and total layers in HE staining (μm), percentage of each layer’s thickness relative to the total layer’s thickness in HE staining (%), percentage of the positively stained area in AB and MT staining (%), and the mean number of cells in each layer and the total layers in HE staining (cells), were examined. First, the Shapiro–Wilk test was performed to classify normally and non-normally distributed variables. Non-normally distributed variables were expressed as medians (range) and compared using the Kruskal–Wallis test. Univariable linear regression analysis was performed using the following dependent variables: the thickness of each layer in HE staining (μm), ratio of each layer to total layers in HE staining (%), percentage of positively stained area in AB staining (%), percentage of positively stained area in MT staining (%), and percentage of ADN-positive areas in the spongiosa layer (%). The independent variables were as follows: group (C and P), age (months), and weight (kg). Additional univariable linear regression was performed with the following dependent variables: the thickness of the spongiosa layer in HE staining (μm), percentage of the spongiosa layer in HE staining (%), percentage of the positively stained area in the spongiosa layer in AB staining (%), and percentage of the spongiosa layer that stained positively for ADN. The independent variables were as follows: group (C and P), age (months), and weight (kg). The results are presented as coefficients (Coe), standard errors (SE), p-values (p), and 95% confidence intervals (CIs). Model diagnostics were performed by assessing the normality of the residuals, and data that were not normally distributed were log-transformed. Stata/IC 14.0 (StataCorp, College Station, TX), a commercial statistical software package, was used for the above-mentioned analyses. Statistical estimation and inference were performed using two-tailed hypotheses and tests at the 5% significance level. Ethical approvalThis study was conducted after approval by the relevant Laboratory Animal Committee (approval number: 2019S-72), and all dogs were handled in accordance with the guidelines for laboratory animals. ResultsDogsThe clinical signs in group P included polyuria, which appeared a few days after the initiation of medication administration; however, no other problems were observed. Owing to an error in tissue processing in one of the samples from group P, the comparison study included six dogs in group C (body weight: 8.5–10.5 kg, median body weight: 9.6 kg, age: 8–19 months, median age: 17.5 months) and five dogs in group P (body weight: 9.5–11.1 kg, median body weight: 10.5 kg, age: 15–17 months, median age: 17 months). For the ACTH stimulation test in group P, the serum cortisol concentration on day 0 was 2.7 (1.1–4.4) μg/dl at baseline and 9.8 (5.0–12.5) μg/dl post-stimulation, and the response in the serum cortisol concentration was assessed after stimulation. In contrast, the serum cortisol concentration on day 84 was 2.2 (0.5–3.7) μg/dl at baseline, 1.5 (0.5–2.2) μg/dl post-stimulation, while no response was observed post-stimulation (the reference ranges of baseline and the post-stimulation cortisol concentration were 1.0–7.8 and 5.0–20.0 μg/dl, respectively). The results of the echocardiographic examinations performed in group P have been reported previously (Tanaka et al., 2021).
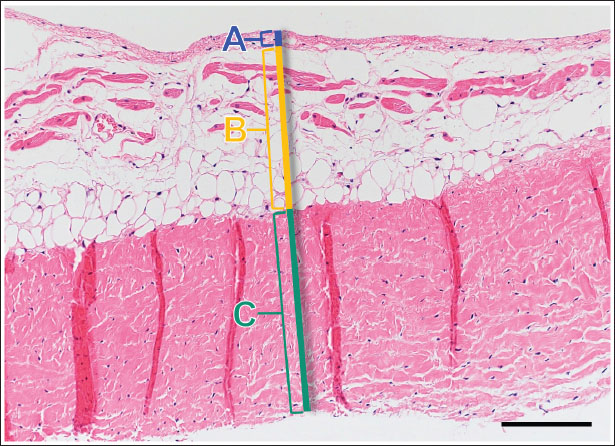
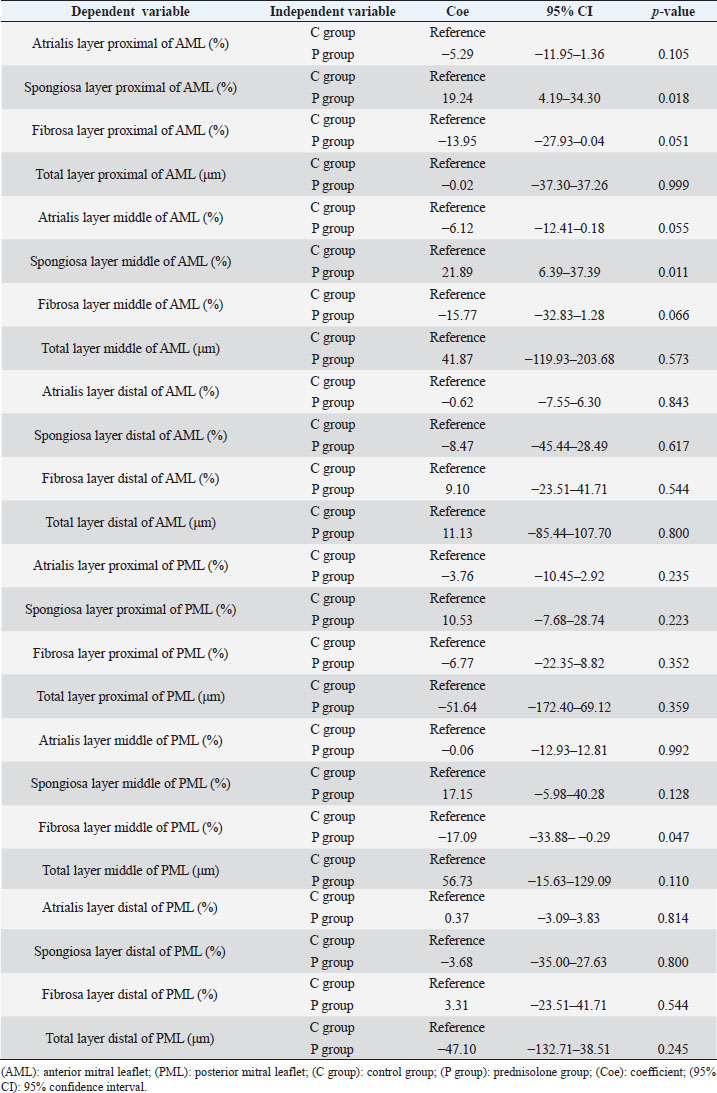
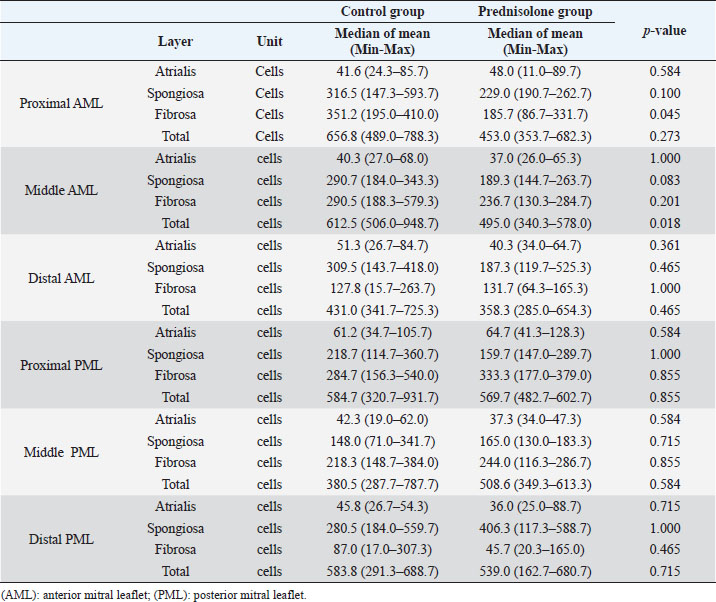
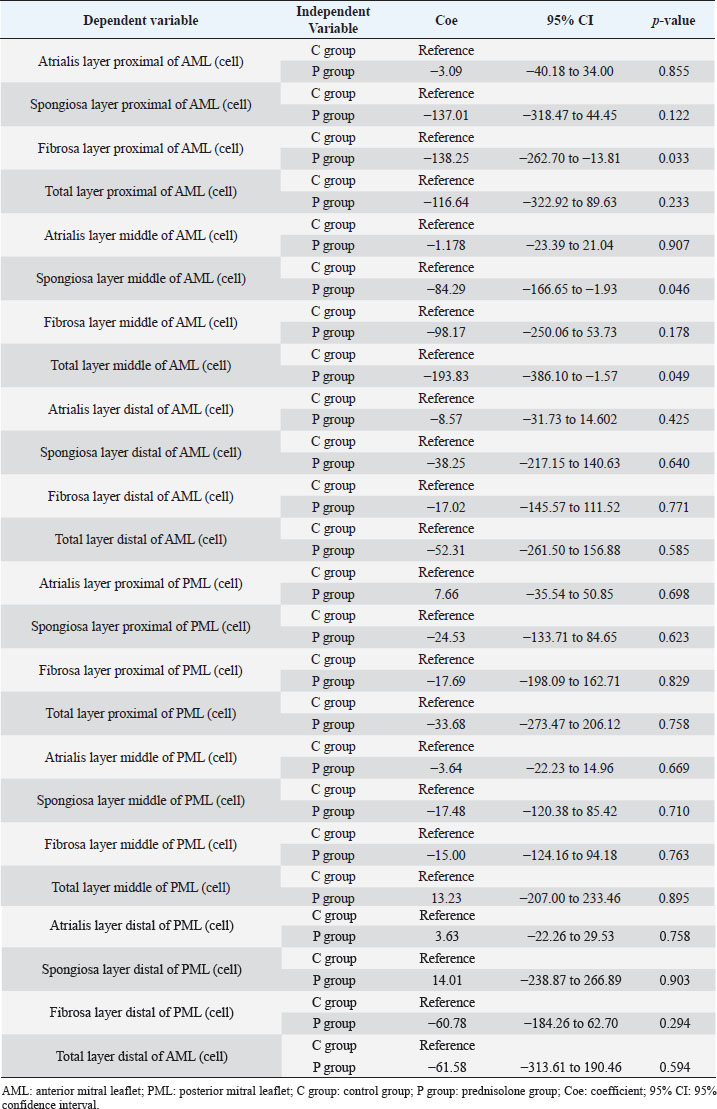
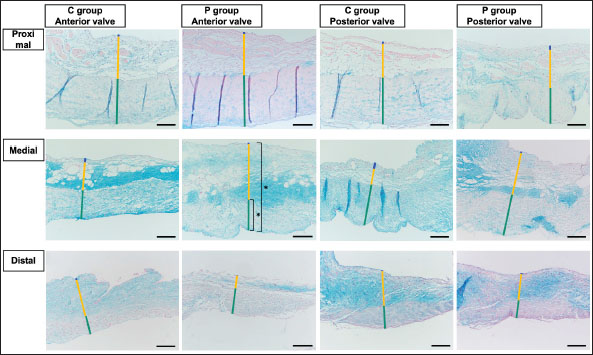
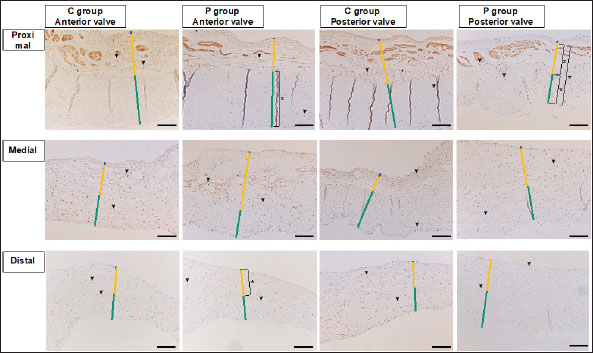
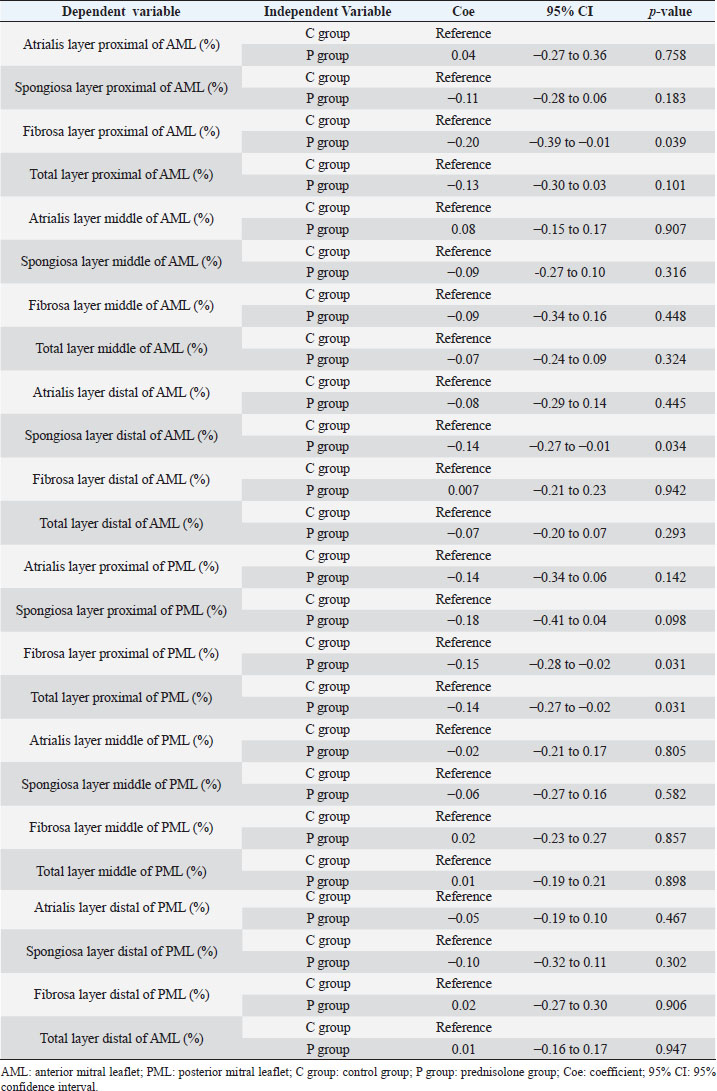
Fig. 1. Image showing each layer (atrialis, spongiosa, and fibrosa layer) used for measurement in a HE-stained sample in the proximal of the AML. (A) Atrialis layer; (B) spongiosa layer; and (C) fibrosa layer. Scale bar: 100 μm. HE stainingHE staining images of the MVs in both groups are presented in Figure 2, and the corresponding characteristics are reported in Table 1. As previously described (Markby et al., 2017), MVs are composed of the atrialis, spongiosa, and fibrosa layers of AML and PML. In the spongiosa layer, many adipocytes were detected in the proximal and middle regions, and thin bundles of cardiomyocytes were scattered in the proximal region. In univariable linear regression, the percentage of the spongiosa to the total layer (%) was greater in group P than in group C at the proximal AML (p=0.018) and middle AML (p=0.011). The percentage of the fibrosa layer to the total layers (%) was lower in group P than in group C in the middle PML (p=0.047) (Table 2). There was no obvious difference in total layer thickness (μm) of either the AML or PML between the two groups. The characteristics, including mean cell numbers at each site and layer thickness, of both groups are presented in Table 3. In the univariable linear regression analysis, cell counts in the fibrosa layer were lower in group P than in group C at the proximal AML (p=0.033), spongiosa layer (p=0.046), and total layers (p=0.049) at the middle of AML (Table 4). There was no association between these parameters and weight and age. AB stainingAB staining images from groups C and P are shown in Figure 3, and the corresponding characteristics are reported in Table 5. AB-positive staining, indicating the presence of acidic sulfated mucosubstances, mostly GAGs, in the MV was mainly detected in the spongiosa layer of the AML in both groups. In most of the tissue samples, the spongiosa layer showed a dense deposition of an AB-positive extracellular matrix, whereas slight deposition was observed in the atrialis and fibrosa layers. In univariable linear regression, the percentage (%) of the positively stained area was lower in group P than in group C in the fibrosa layer of the middle AML (p=0.031) and the total middle AML (p=0.023) (Table 6). Positive associations were observed between the percentage of AB-positive areas and the thickness of the total layers (Coe: 0.11 μm, 95% CI: 0.086–0.134, p < 0.0001), HE-staining results of the percentage of each layer (Coe: 0.39%, 95% CI: 0.31–0.45, p < 0.0001), and cell count (Coe: 0.053 cell, 95% CI: 0.04–0.06, p < 0.0001). The percentage of AB-positive areas was not associated with body weight and age.
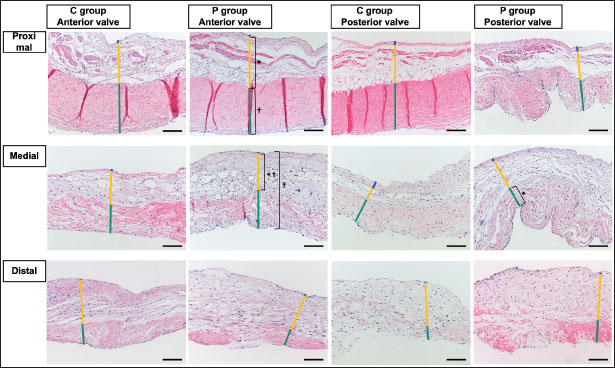
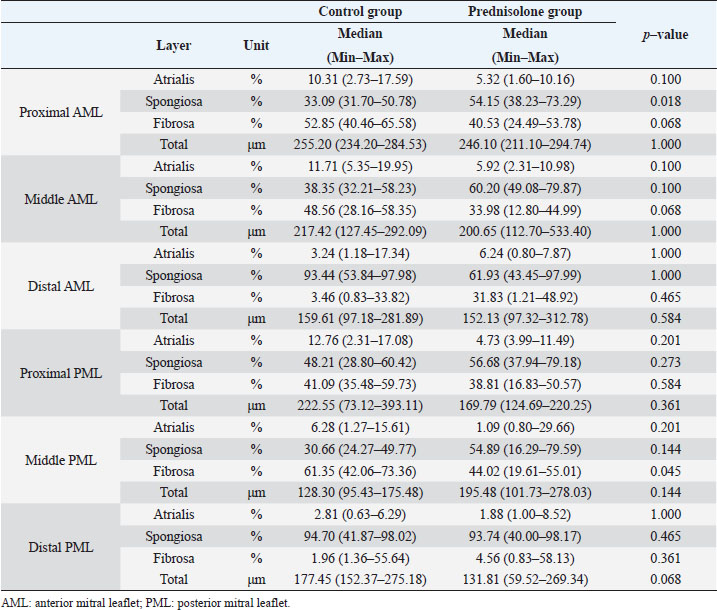
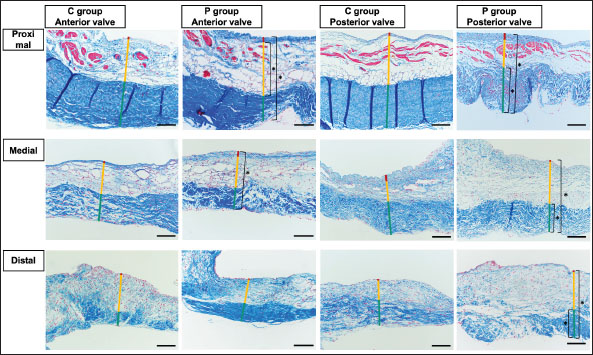
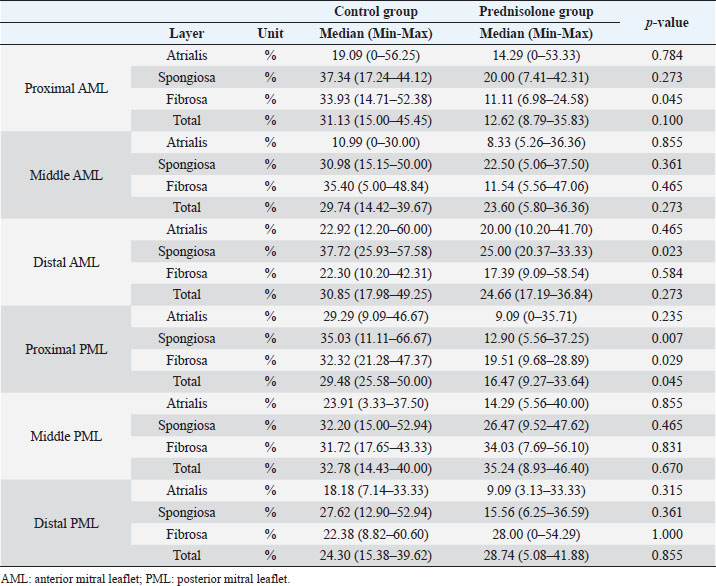
Fig. 2. HE-stained sample images of the MV (AML and PML) in the control and prednisolone groups. C group: Control group; P group: Prednisolone group; blue bar: atrialis layer; yellow bar: spongiosa layer; green bar: fibrosa layer; *: in univariable linear regression, the percentage (%) of the total layer occupied by the spongiosa layer was higher in group P than in group C at the proximal (p=0.018) and middle AML (p=0.011). In contrast, the percentage of the fibrosa layer thickness to the total layer thickness (%) was lower in group P than in group C in the middle PML region (p=0.047) (Table 2); †: in univariable linear regression, cell counts in the fibrosa layer were lower in group P than in group C at the proximal AML (p=0.033), in the spongiosa layer (p=0.046), and overall (p=0.049) at the middle AML region (Table 4). Scale bar: 100 μm. Table 1. Total thickness (μm) and percentage of each layer (%) relative to the total thickness at the proximal, middle, and distal of the MV (AML and PML) in the control (n=6) and prednisolone (n=5) groups in samples stained with HE.
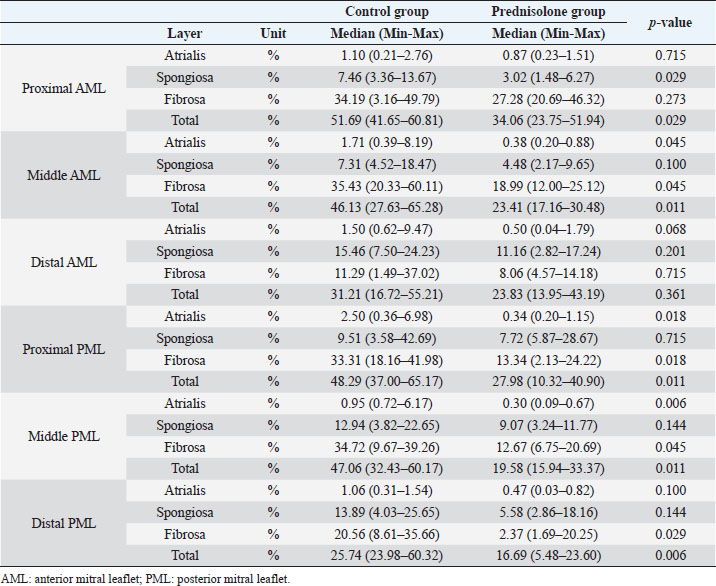
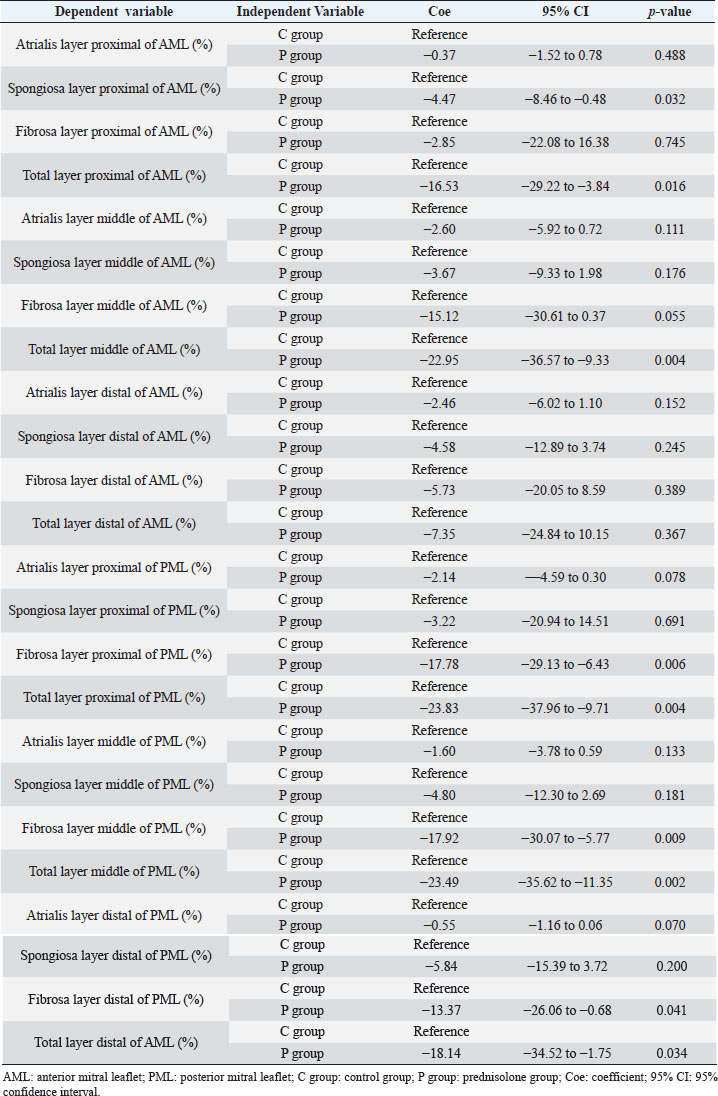
MT stainingThe results of MT staining in both groups are presented in Figure 4, and the corresponding characteristics are presented in Table 7. MT-positive staining, indicating the presence of collagen, was mainly detected in the fibrosa layer of the AML and PML in both groups. MT-positive staining was densely distributed in the fibrosa layer but was sparse in the atrialis and spongiosa layers. Univariable linear regression analysis showed that the percentage of the positively stained area (%) was lower in group P than in group C in the spongiosa layer and total layers in the proximal (p=0.032 and 0.004, respectively) and in the middle (p=0.004) of the AML. In the PML, the percentage of the positively stained area (%) was lower in the P than in the C group in the fibrosa and overall layers at the proximal end (p=0.006 and 0.004, respectively), in the fibrosa and total layers in the middle region (p=0.009 and 0.002, respectively), and in the fibrosa and total layers at the distal region (p=0.041 and 0.034, respectively) (Table 8). Positive associations were observed between the percentages of MT-positive areas (%) and the HE staining results of the thickness of total layers (Coe: 0.09 μm, 95% CI: 0.07–0.11, p < 0.0001), the percentage of each layer (Coe: 0.17%, 95% CI: 0.11–0.23, p < 0.0001), and cell count (Coe: 0.05 cells, 95% CI: 0.04–0.06, p < 0.0001). A positive association was also observed between the MT and AB staining results (%) (Coe: 0.27%, 95% CI: 0.17–0.36, p < 0.0001). The MT staining results were not associated with body weight and age. Table 2. Results of the univariable linear regression for the total thickness (μm) and the percentage of each layer (%) relative to the total thickness at the proximal, middle, and distal of the mitral valve (anterior and posterior mitral leaflets) in the control (n=6) and prednisolone (n=5) groups in samples stained with hematoxylin and eosin.
Table 3. Mean cell counts (cells/field of view) at the proximal, middle, and distal of the mitral valve (anterior and posterior mitral leaflets) in the control (n=6) and prednisolone (n=5) groups in samples stained with hematoxylin–eosin.
Table 4. Results of univariable linear regression for the mean cell counts (cells/field of view) at proximal, middle, and distal of the MV (AML and PML) in the control (n=6) and prednisolone (n=5) groups in samples stained with HE.
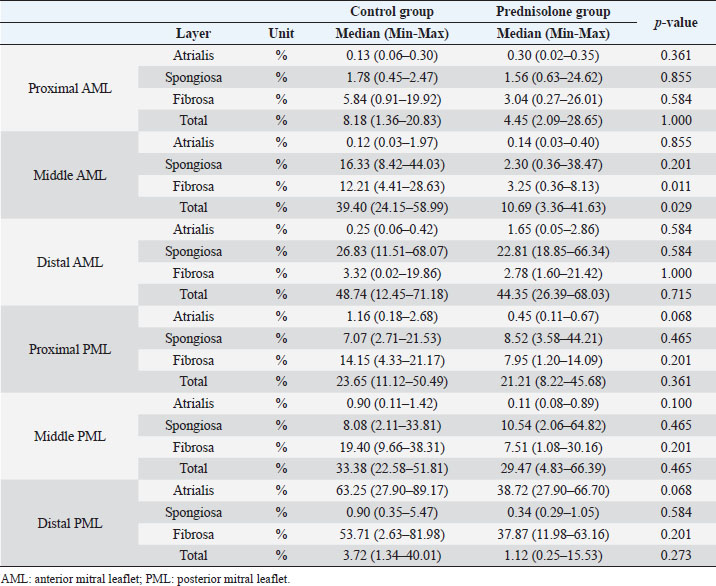
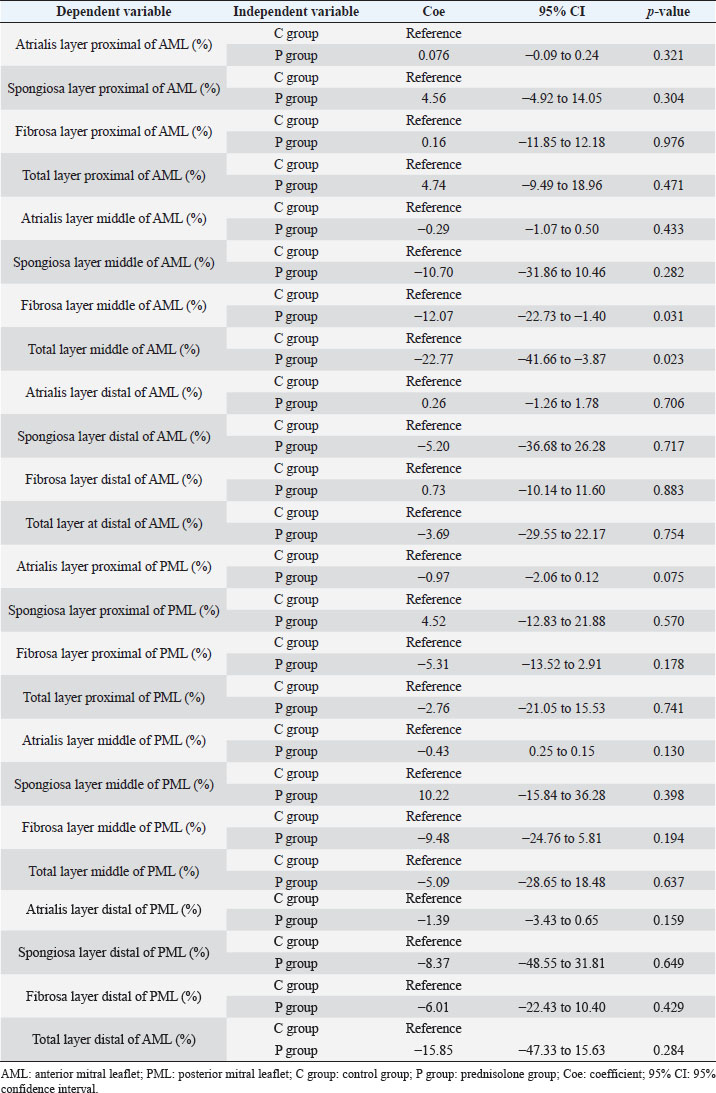
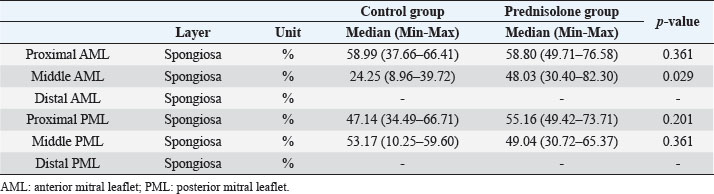
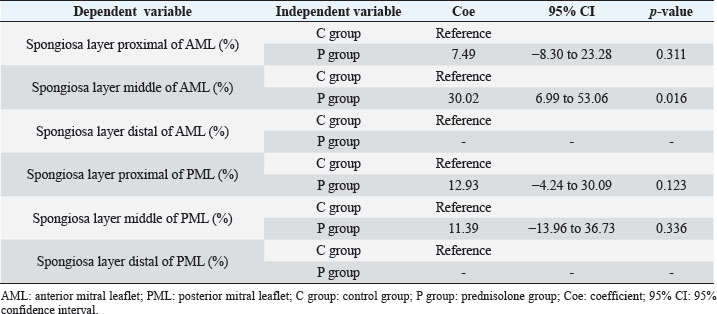
Fig. 3. AB-stained sample images of the MV (AML and PML) in the control and prednisolone groups. The light blue stained areas indicate the presence of acidic sulfated mucosubstances. C group: Control group; P group: Prednisolone group; blue bar: atrialis layer; yellow bar: spongiosa layer; green bar: fibrosa layer; *: in univariable linear regression, the percentage (%) of the positively stained area was lower in group P than in group C in the fibrosa layer of the middle AML (p=0.031) and the total layer of the middle AML (p=0.023) (Table 6). Scale bar: 100 μm. Immunohistochemical stainingADN immunohistochemistry revealed that ADN was mainly expressed in the cytoplasm of mature adipocytes in the spongiosa layer of the proximal part and the middle of the AML and PML in both groups (Fig. 5). The corresponding characteristics are presented in Table 9. Univariable linear regression revealed that the percentage of ADN-positive areas in the spongiosa layer was higher in the P than in the C group in the middle AML (p=0.016). In contrast, there was no clear difference in the proximal AML (p=0.311) or proximal and middle PML (p=0.123 and 0.366, respectively) between the two groups (Table 10). The distal area could not be evaluated, as the expression of ADN was unclear. There was no association between the percentage of ADN-positive areas and the HE staining results of the thickness of the layers, percentage of each layer, or cell counts. A negative association was observed between the ADN immunohistochemical and AB staining results (Coe: −0.38%, 95% CI: −0.60 to −0.16, p=0.001). There was no association between the ADN immunohistochemistry results and the percentage of MT-positive areas, body weight, or age. Table 5. Percentage of the positive staining area (%) at the proximal, middle, and distal of the MV (AML and PML) in the control (n=6) and prednisolone (n=5) groups in samples stained with AB.
GCR-immunohistochemistry showed that GCR-positive nuclei were mainly present in adipocytes and cardiomyocytes in the spongiosa layer as well as in the fibrosa layer of the AML and PML in both groups C and P (Fig. 6). The corresponding characteristics are presented in Table 11. Univariable linear regression revealed that the percentage of GCR-positive nuclei in the fibrosa layer in the proximal AML (p=0.039) and spongiosa layer in the distal AML (p=0.034) was lower in the P than in the C group. In the PML, the percentage of GCR-positive nuclei was lower in the P than in the C group in the fibrosa and total layers in the proximal region (p=0.031 and 0.031, respectively) (Table 12). DiscussionIn this study, we demonstrated that long-term administration of high-dose prednisolone induced histological changes in the MV in dogs, such as decreased deposition of collagen and acidic sulfated mucosubstances and an increase in the spongiosa layer thickness, accompanied by an increase in adipocytes. However, there were no obvious differences in the total layer thickness or the amount of acidic sulfated mucosubstances in the spongiosa layer between the two groups. GCR-immunoreactivity was mainly detected in the cardiomyocytes and spongiosa layers, including in the adipocytes and the fibrosa layers, indicating that the MV could be an important target of GCs. These findings suggest that persistent HGC directly affects and induces histological changes in the MV. In this study, despite the decrease in the number of cells in the spongiosa layer of the AML, an increase in the percentage of the spongiosa layer thickness to the total layer thickness was observed, and there was no accumulation of acidic sulfated mucosubstances. Furthermore, ADN immunohistochemistry confirmed the presence of mature adipocytes in the spongiosa layer and showed a significant increase in the area consisting of ADN-positive adipocytes in the middle area of the AML in group P as compared to group C. It has been reported that adipocytes are present in the spongiosa layer in the proximal third of normal MV leaflets in dogs (Fox, 2012). In humans, GCs may promote the differentiation of pre-adipocytes into mature adipocytes in a dose-dependent manner, resulting in adipocyte hypertrophy (Ottosson et al., 2000; Peckett et al., 2011). The observed inconsistency in the spongiosa layer may be accounted for by persistent HGC, which may have caused hypertrophy of adipocytes and the increase in the ADN-positive adipocyte area in the spongiosa layer. In addition, it has been reported that acidic sulfated mucosubstances may exert lipolytic effects by activating lipoprotein lipase (Gallagher et al., 1986). In this study, there was no obvious difference in the acidic sulfated mucosubstance level in the spongiosa layer in the middle AML between the two groups, suggesting that the enlargement of adipocytes in the spongiosa layer was not caused by a decrease in acidic sulfated mucosubstances, but rather attributed to the stimulation of adipocytes by GCs (Ottosson et al., 2000; Peckett et al., 2011). Table 6. Results of the univariable linear regression for the percentage of positive staining area (%) at the proximal, middle, and distal of the MV (AML and PML) in the control (n=6) and prednisolone groups (n=5) in samples stained with AB.
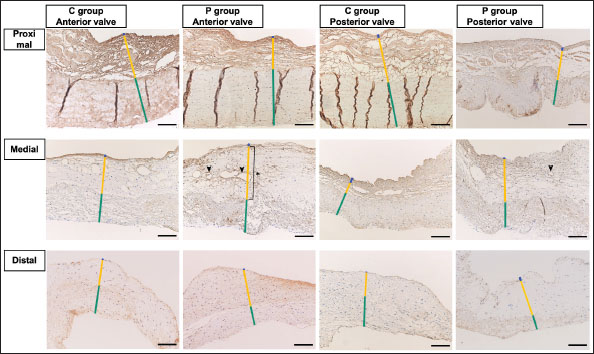
Fig. 4. MT-stained sample images of the MV (AML and PML) in the control and prednisolone groups. The blue-stained areas indicate the presence of collagen-rich deposits. C group: Control group; P group: Prednisolone group; blue bar: atrialis layer; yellow bar: spongiosa layer; green bar: fibrosa layer; *: univariable linear regression analysis of the percentage of the positively stained area (%) was lower in group P than in group C in the spongiosa layer and total layers of the proximal AML (p=0.032 and 0.004, respectively); in the total layer of the middle of the AML (p=0.004); in the fibrosa layer and total layers of the proximal PML (p=0.006 and 0.004, respectively); in the fibrosa layer and total layers in the middle PML (p=0.009 and 0.002, respectively); and in the fibrosa layer and total layers in the distal of the PML (p=0.041, 0.034) (Table 8). Scale bar: 100 μm. Table 7. Percentage of the positive staining area (%) at the proximal, middle, and distal of the MV (AML and PML) between the control and prednisolone groups in samples stained with MT.
Regarding the decreased acidic sulfated mucosubstances in the fibrosa and the total layer of the middle of the AML, GAGs have been shown to be particularly densely distributed in the spongiosa, whereas they are detected throughout the atrioventricular heart valves (Lovekamp et al., 2006; Ross et al., 2019). Recently, biaxial mechanical testing of extensibility after GAG removal in the atrioventricular heart valves of pigs showed significantly reduced stress decay and larger tissue extensibility than that in untreated tissue (Ross et al., 2019). This report indicated that GAGs are important for the normal function of atrioventricular heart valves, and GAG deficiency can lead to a significant increase in extensibility, which can cause unforeseen events, such as valvular heart disease. Type I and III collagen are present in the MV (ratio of 3:1), regarding the decreased deposition of collagen; in the AML—specifically, in the spongiosa and total layer of the proximal region, and in the total layer of the middle region; in the PML—specifically, in the fibrosa and total layer of proximal, middle, and distal regions (Kunzelman et al., 1998). These fibrillar collagens form banded fibrils and provide tissues with tensile strength, while also influencing cell attachment and migration (Ku et al., 2006). A report focusing on the MV in sheep suggests that a decrease in collagen density may result in a decrease in the stiffness and stress level of MVs (Kunzelman et al., 1998). Therefore, the reduction of acidic sulfated mucosubstances and collagen deposition in group P may lead to mechanical abnormalities (mainly reduced resistance to mechanical loading). It should be noted that prednisolone has a weak aldosterone action as well as strong GC action. Specifically, it has been reported that aldosterone may be associated with fibromyxomatous alterations by increasing proteoglycan (core protein and GAG-bound) secretion in the MV (Ibarrola et al., 2020). However, in this study, GAGs decreased in the P group, which is not consistent with the histological changes caused by aldosterone. Therefore, in this study, the decrease in the GAG level may be attributed to the GC effect of prednisolone. Table 8. Results of the univariable linear regression for the percentage of the positive staining area (%) at the proximal, middle, and distal of the MV (AML and PML) in the control (n=6) and prednisolone groups (n=5) in samples stained with MT.
Fig. 5. ADN-immunohistochemistry images of the MV (AML and PML) in the control and prednisolone groups. Arrowheads show ADN-positive areas in the cytoplasm of mature adipocytes in the spongiosa layer. C group: Control group; P group: Prednisolone group; blue bar: atrialis layer; yellow bar: spongiosa layer; green bar: fibrosa layer; *: in univariable linear regression the percentage of the ADN-positive areas in the spongiosa layer was higher in group P than in group C in the middle of the AML (p=0.016) (Table 9). Scale bar: 100 μm. Table 9. Percentage of the po sitive staining area (%) at proximal, middle, and distal of the MV (AML and PML) in the control (n=6) and prednisolone (n=5) groups in samples immunohistochemically stained for ADN.
Table 10. Results of the univariable linear regression for the percentage of the positive staining area (%) at the proximal, middle, and distal of the MV (AML and PML) in the control (n=6) and prednisolone (n=5) groups in samples immunohistochemically stained with ADN.
Fig. 6. GCR immunohistochemistry images of the MV (AML and PML) in the control and prednisolone groups. Arrowheads show GCR-positive nuclei in the spongiosa (mainly expressed in adipocytes and cardiomyocytes) and fibrosa layer. C group: Control group; P group: Prednisolone group; blue bar: atrialis layer; yellow bar: spongiosa layer; green bar: fibrosa layer; *: univariable linear regression analysis of the percentage of GCR-positive nuclei (%) was lower in group P than in group C in the fibrosa layer in the proximal AML (p=0.039); in the spongiosa layer in the distal AML (p=0.034); in the fibrosa and total layers in the proximal PML (p=0.031 and 0.031, respectively) (Table 12). GCR was expressed in the spongiosa and fibrosa layers of the AML and PML in groups C and P. Scale bar: 100 μm. The results of HE and AB staining showed that the changes occurred mainly in the AML, which tended to show more evidence of degeneration than the PML. This trend was similar to that reported in a previous study of mitral regurgitation, the most common valvular disease in dogs, in which the AML and PML deviation values were reported to be 48.4% and 7.1%, respectively (44.5% AML and PML deviation) (Terzo et al., 2009). This finding may be accounted for by the observation that, in normal MVs, the AML is larger in size than the PML (Fox, 2012) and is susceptible to the effects of the high circulating GC levels in HAC. In addition, the areas of degeneration in group P were mainly at the proximal or middle of AML, and there was little histological difference between the two groups at the distal end of the valve leaflet. These findings may be accounted for by canine blood vessels that are distributed from the valve attachment to two-thirds of the total length of the valve (Sonnenblick et al., 1967). In the proximal and middle parts of the valve, where degeneration was mainly observed in this study, the effects of HGC may have been influenced by the blood flow hitting the MV surface in the heart and the blood supply in the MV. Table 11. Percentage of the positive nuclei (%) at the proximal, middle, and distal of the MV (AML and PML) between the control and prednisolone groups in samples immunohistochemically stained with GCR.
The GCR immunohistochemistry results showed that the percentage of GCR-positive nuclei in group P was significantly reduced compared to that in group C. As excess GC has been reported to downregulate the GCR (Lipworth, 2000; Tanaka et al., 2021), in this study, persistent HGC from continuous prednisolone administration may have affected the MV and may have downregulated GCR in the MV. The results of this study suggest that persistent HGC exposure causes histological changes in the MV and associated mechanical abnormalities, such as an increase in extensibility and a decrease in stiffness and the stress level. HAC, the most common cause of HGC in dogs, is also common in middle-aged and older dogs, and this age of predilection overlaps with the age at which chronic valvular disease is prevalent (Olsen et al., 2003; Connell et al., 2012). Therefore, prolonged administration of synthetic GCs or the presence of HAC in dogs with chronic valvular disease, the most common cardiac disease in dogs, may further contribute to mechanical abnormalities in the MV. This study has several limitations. First, the number of dogs used in this study was small, because we used the minimum number of animals required in respect of ethical standards. Nevertheless, the presented findings may be affected by outliers. Second, prednisolone has four times stronger GC activity than cortisol; therefore, the effect of GC on the MV tissue in this study may have been greater than that in patients with HAC (Feldman and Nelson, 2003). In this regard, it has been reported that left ventricular hypertrophy and cardiac dysfunction in dogs and humans with CS are influenced by disease persistence (Fallo et al., 1994; Muiesan et al., 2003). Third, although HGC persists in spontaneous HAC, the dogs in group P were administered prednisolone twice daily, which may have caused an intermittent increase in blood counts, and the duration of systemic organ exposure to GCs may have been different from that in clinical cases of CS. Fourth, hypertrophy and diastolic dysfunction of the left ventricular myocardium were observed in group P (Tanaka et al., 2021), and we cannot rule out the possibility that the histological changes in the MV observed in this study were secondary to myocardial remodeling. Table 12. Results of the univariable linear regression for the percentage of the positive nuclei (%) at the proximal, middle, and distal of the MV (AML and PML) in the control (n=6) and prednisolone groups (n=5) in samples immunohistochemically stained with GCR.
Overall, this study revealed that HGC may cause histological changes in the MV. HGC may adversely affect the cardiovascular system in animals and humans (Sugihara et al., 1992; Chen et al., 2014; Isidori et al., 2015; Oui et al., 2015; Takano et al., 2015; Tanaka et al., 2021). The present findings may help elucidate the effects of HGC on the cardiovascular system, following recent reports (Sugihara et al., 1992; Chen et al., 2014; Isidori et al., 2015; Oui et al., 2015; Takano et al., 2015; Tanaka et al., 2021). AcknowledgmentsThis research was supported by the Japan Society for the Promotion of Science, Grant-in-Aid for Scientific Research (project number: 17K08114). We thank Editage (www.editage.jp) for editing this manuscript. Conflict of interestThe authors declare that there is no conflict of interest. Author contributionsSachiyo TANAKA: conceptualization, experiment design, data collection, writing first draft, and manuscript editing. Shuji SUZUKI: experiment design, data collection, and manuscript editing. Misaki SHIMURA: experiment design, data collection, writing first draft, and manuscript editing. Asaka SATO: conceptualization, experiment design, and manuscript editing. Aki TANAKA: data collection, writing first draft, and manuscript editing. Satoshi SOETA: experiment design, data collection, writing first draft, and manuscript editing. Yasushi HARA: conceptualization, experiment design, writing first draft, and manuscript editing. All authors read and approved the final version of the paper. ReferencesBehrend, E.N., Kooistra, H.S., Nelson, R., Reusch, C.E. and Scott-Moncrieff, J.C. 2013. Diagnosis of spontaneous canine hyperadrenocorticism: 2012 ACVIM consensus statement (small animal). J. Vet. Intern. Med. 27, 1292–1304. Boscaro, M., Barzon, L., Fallo, F. and Sonino, N. 2001. Cushing's syndrome. Lancet 357, 783–791. Carotenuto, G., Malerba, E., Dolfini, C., Brugnoli, F., Giannuzzi, P., Semprini, G., Tosolini, P. and Fracassi, F. 2019. Cushing's syndrome-an epidemiological study based on a canine population of 21,281 dogs. Open Vet. J. 9, 27–32. Chen, H.Y., Lien, Y.H. and Huang, H.P. 2014. Assessment of left ventricular function by two-dimensional speckle-tracking echocardiography in small breed dogs with hyperadrenocorticism. Acta Vet. Scand. 56, 88. Connell, P.S., Han, R.I. and Grande-Allen, K.J. 2012. Differentiating the aging of the mitral valve from human and canine myxomatous degeneration. J. Vet. Cardiol. 14, 31–45. de Bruin, C., Meij, B.P., Kooistra, H.S., Hanson, J.M., Lamberts, S.W. and Hofland, L.J. 2009. Cushing's disease in dogs and humans. Horm. Res. 71, 140–143. Fallo, F., Budano, S., Sonino, N., Muiesan, M.L., Agabiti-Rosei, E. and Boscaro, M. 1994. Left ventricular structural characteristics in Cushing's syndrome. J. Hum. Hypertens. 8, 509–513. Feldman, E. C. and Nelson, R.W. 2003. Canine and feline endocrinology & reproduction, 3rd ed. St. Louis, MO: Saunders. Fox, P.R. 2012. Pathology of myxomatous mitral valve disease in the dog. J. Vet. Cardiol. 14, 103–126. Gallagher, J.T., Lyon, M. and Steward, W.P. 1986. Structure and function of heparan sulphate proteoglycans. Biochem. J. 236, 313–325. Han, R.I., Black, A., Culshaw, G., French, A.T. and Corcoran, B.M. 2010. Structural and cellular changes in canine myxomatous mitral valve disease: an image analysis study. J. Heart Valve Dis. 19, 60–70. Ibarrola, J., Garcia-Peña, A., Matilla, L., Bonnard, B., Sádaba, R., Arrieta, V., Alvarez, V., Fernández-Celis, A., Gainza, A., Navarro, A., Alvarez de la Rosa, D., Rossignol, P., Jaisser, F. and López-Andrés, N., 2020. A new role for the aldosterone/mineralocorticoid receptor pathway in the development of mitral valve prolapse. Circ. Res. 127, e8–e93. Isidori, A.M., Graziadio, C., Paragliola, R.M., Cozzolino, A., Ambrogio, A.G., Colao, A., Corsello, S.M., Pivonello, R. and ABC Study Group. 2015. The hypertension of Cushing's syndrome: controversies in the pathophysiology and focus on cardiovascular complications. J. Hypertens. 33, 44–60. Komiyama, N., Tsumagari, S., Ohba, S., Takagi, K., Satoh, S. and Takeishi, M. 1991. Hypophyseal-adrenocortical function in experimental iatrogenic canine Cushing's syndrome. J. Vet. Med. Sci. 53, 351–353. Ku, C.H., Johnson, P.H., Batten, P., Sarathchandra, P., Chambers, R.C., Taylor, P.M., Yacoub, M.H. and Chester, A.H. 2006. Collagen synthesis by mesenchymal stem cells and aortic valve interstitial cells in response to mechanical stretch. Cardiovasc. Res. 71, 548–556. Kunzelman, K.S., Quick, D.W. and Cochran, R.P. 1998. Altered collagen concentration in mitral valve leaflets: biochemical and finite element analysis. Ann. Thorac. Surg. 66, S198–S205. Lipworth, B.J., 2000. Therapeutic implications of non-genomic glucocorticoid activity. Lancet 356, 87–89. Lovekamp, J.J., Simionescu, D.T., Mercuri, J.J., Zubiate, B., Sacks, M.S. and Vyavahare, N.R. 2006. Stability and function of glycosaminoglycans in porcine bioprosthetic heart valves. Biomaterials 27, 1507–1518. Markby, G., Summers, K.M., MacRae, V.E., Del-Pozo, J. and Corcoran, B.M. 2017. Myxomatous degeneration of the canine mitral valve: from gross changes to molecular events. J. Comp. Pathol. 156, 371–383. Muiesan, M.L., Lupia, M., Salvetti, M., Grigoletto, C., Sonino, N., Boscaro, M., Rosei, E.A., Mantero, F. and Fallo, F. 2003. Left ventricular structural and functional characteristics in Cushing's syndrome. J. Am. Coll. Cardiol. 41, 2275–2279. Nieman, L.K. 2015. Cushing's syndrome: update on signs, symptoms and biochemical screening. Eur. J. Endocrinol. 173, M33–M38. Nivy, R., Refsal, K.R., Ariel, E., Kuzi, S., Yas-xNatan, E. and Mazaki-Tovi, M. 2018. The interpretive contribution of the baseline serum cortisol concentration of the ACTH stimulation test in the diagnosis of pituitary dependent hyperadrenocorticism in dogs. J. Vet. Intern. Med. 32, 1897–1902. Olsen, L.H., Martinussen, T. and Pedersen, H.D. 2003. Early echocardiographic predictors of myxomatous mitral valve disease in dachshunds. Vet. Rec. 152, 293–297. Ottosson, M., Lönnroth, P., Björntorp, P. and Edén, S. 2000. Effects of cortisol and growth hormone on lipolysis in human adipose tissue. J. Clin. Endocrinol. Metab. 85, 799–803. Oui, H., Jeon, S., Lee, G., Park, S., Cho, K.O. and Choi, J. 2015. Tissue Doppler and strain imaging of left ventricle in Beagle dogs with iatrogenic hypercortisolism. J. Vet. Sci. 16, 357–365. Peckett, A.J., Wright, D.C. and Riddell, M.C. 2011. The effects of glucocorticoids on adipose tissue lipid metabolism. Metabolism 60, 1500–1510. Ross, C.J., Laurence, D.W., Richardson, J., Babu, A.R., Evans, L.E., Beyer, E.G., Childers, R.C., Wu, Y., Towner, R.A., Fung, K.M., Mir, A., Burkhart, H.M., Holzapfel, G.A. and Lee, C.H. 2019. An investigation of the glycosaminoglycan contribution to biaxial mechanical behaviours of porcine atrioventricular heart valve leaflets. J. R. Soc. Interface. 16, 20190069. Sonnenblick, E.H., Napolitano, L.M., Daggett, W.M. and Cooper, T. 1967. An intrinsic neuromuscular basis for mitral valve motion in the dog. Circ. Res. 21, 9–15. Sugihara, N., Shimizu, M., Kita, Y., Shimizu, K., Ino, H., Miyamori, I., Nakabayashi, H. and Takeda, R. 1992. Cardiac characteristics and postoperative courses in Cushing's syndrome. Am. J. Cardiol. 69, 1475–1480. Takano, H., Kokubu, A., Sugimoto, K., Sunahara, H., Aoki, T. and Fijii, Y. 2015. Left ventricular structural and functional abnormalities in dogs with hyperadrenocorticism. J. Vet. Cardiol. 17, 173–181. Tanaka, S., Shibuya, H., Suzuki, S., Kanno, N., Harada, Y., Sato, A., Soeta, S. and Hara, Y. 2021. Long-term administration of prednisolone: effects on the myocardial tissue of healthy beagle dogs. J. Vet. Med. Sci. 83, 84–93. Terzo, E., Di Marcello, M., McAllister, H., Glazier, B., Lo Coco, D., Locatelli, C., Palermo, V. and Brambilla, P. G. 2009. Echocardiographic assessment of 537 dogs with mitral valve prolapse and leaflet involvement. Vet. Radiol. Ultrasound. 50, 416–422. van der Pas, R., Leebeek, F.W.G., Hofland, L.J., De Herder, W.W. and Feelders, R.A. 2013. Hypercoagulability in Cushing's syndrome: prevalence, pathogenesis and treatment. Clin. Endocrinol. 78, 481–488. | ||
| How to Cite this Article |
| Pubmed Style ST, SS, Shimura M, Kawana A, Tanaka A, Soeta S, Hara Y. Long-term histological effects of high-dose prednisolone administration on the mitral valve in normal Beagle dogs. Open Vet J. 2023; 13(2): 150-170. doi:10.5455/OVJ.2023.v13.i2.3 Web Style ST, SS, Shimura M, Kawana A, Tanaka A, Soeta S, Hara Y. Long-term histological effects of high-dose prednisolone administration on the mitral valve in normal Beagle dogs. https://www.openveterinaryjournal.com/?mno=88087 [Access: April 19, 2024]. doi:10.5455/OVJ.2023.v13.i2.3 AMA (American Medical Association) Style ST, SS, Shimura M, Kawana A, Tanaka A, Soeta S, Hara Y. Long-term histological effects of high-dose prednisolone administration on the mitral valve in normal Beagle dogs. Open Vet J. 2023; 13(2): 150-170. doi:10.5455/OVJ.2023.v13.i2.3 Vancouver/ICMJE Style ST, SS, Shimura M, Kawana A, Tanaka A, Soeta S, Hara Y. Long-term histological effects of high-dose prednisolone administration on the mitral valve in normal Beagle dogs. Open Vet J. (2023), [cited April 19, 2024]; 13(2): 150-170. doi:10.5455/OVJ.2023.v13.i2.3 Harvard Style , S. T., , . S. S., Shimura, . M., Kawana, . A., Tanaka, . A., Soeta, . S. & Hara, . Y. (2023) Long-term histological effects of high-dose prednisolone administration on the mitral valve in normal Beagle dogs. Open Vet J, 13 (2), 150-170. doi:10.5455/OVJ.2023.v13.i2.3 Turabian Style , Sachiyo Tanaka, Shuji Suzuki, Misaki Shimura, Asaka Kawana, Aki Tanaka, Satoshi Soeta, and Yasushi Hara. 2023. Long-term histological effects of high-dose prednisolone administration on the mitral valve in normal Beagle dogs. Open Veterinary Journal, 13 (2), 150-170. doi:10.5455/OVJ.2023.v13.i2.3 Chicago Style , Sachiyo Tanaka, Shuji Suzuki, Misaki Shimura, Asaka Kawana, Aki Tanaka, Satoshi Soeta, and Yasushi Hara. "Long-term histological effects of high-dose prednisolone administration on the mitral valve in normal Beagle dogs." Open Veterinary Journal 13 (2023), 150-170. doi:10.5455/OVJ.2023.v13.i2.3 MLA (The Modern Language Association) Style , Sachiyo Tanaka, Shuji Suzuki, Misaki Shimura, Asaka Kawana, Aki Tanaka, Satoshi Soeta, and Yasushi Hara. "Long-term histological effects of high-dose prednisolone administration on the mitral valve in normal Beagle dogs." Open Veterinary Journal 13.2 (2023), 150-170. Print. doi:10.5455/OVJ.2023.v13.i2.3 APA (American Psychological Association) Style , S. T., , . S. S., Shimura, . M., Kawana, . A., Tanaka, . A., Soeta, . S. & Hara, . Y. (2023) Long-term histological effects of high-dose prednisolone administration on the mitral valve in normal Beagle dogs. Open Veterinary Journal, 13 (2), 150-170. doi:10.5455/OVJ.2023.v13.i2.3 |

