


| Research Article | ||
Open Vet J. 2023; 13(9): 1071-1081 Open Veterinary Journal, (2023), Vol. 13(9): 1071–1081 Original Research Computed tomography of the coelomic cavity in healthy veiled chameleons (Chamaeleo calyptratus) and panther chameleons (Furcifer pardalis)Adrián Melero1,2*, Judit Verdés2, Yvonne Espada2,3, Rosa Novellas2,3, Mario Encinoso2,4 and Jaume Martorell2,31Exòtica Veterinaris, Barcelona, Spain 2Fundació Hospital Clínic Veterinari, Universitat Autònoma de Barcelona, Barcelona, Spain 3Departament de Medicina i Cirurgia Animal, Facultat de Veterinària, Universitat Autònoma de Barcelona, Barcelona, Spain 4Hospital Clínico Veterinario, Facultad de Veterinaria, Universidad de las Palmas de Gran Canaria, Las Palmas, Spain *Corresponding Author: Adrián Melero Jurado. Exòtica Veterinaris, Barcelona, Spain. Email: adrian.vetexotic [at] hotmail.com Submitted: 15/09/2022 Accepted: 05/08/2023 Published: 30/09/2023 © 2023 Open Veterinary Journal
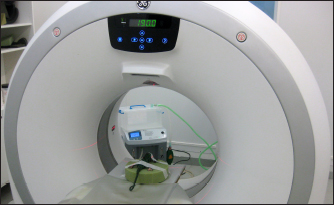
AbstractBackground: Veiled chameleon (Chamaeleo calyptratus) and panther chameleon (Furcifer pardalis) are two of the most popular pet chameleons, and consequently, these species are frequently evaluated in veterinary practices. According to our review of the literature, normal computed tomography (CT) anatomy of these lizards has not been previously described. Aim: The purposes of this prospective study were to describe the normal CT anatomy of the coelomic organs in healthy patients and to provide normal reference values in these species. Methods: Seventeen clinically healthy veiled chameleons and 15 clinically healthy panther chameleons were included. All CT studies were performed with the chameleons under light anesthesia and positioned in sternal recumbency. Studies were performed with a 16-slice helical CT scanner with a slice thickness of 0.625 mm. The authors recorded qualitative and quantitative CT characteristics of the coelomic structures. Macroscopic cross-sectional anatomy was performed for comparison of the CT findings. Results: Heart, lungs, liver, including caudal vena cava, hepatic vessels, gallbladder, esophagus, stomach, intestines, gonads, fat bodies, kidneys, and urinary bladder could be visualized with CT. The spleen, pancreas, and adrenal glands could not be identified. Conclusion: This study provides a guide to the normal cross-sectional and computed tomographic anatomy of the coelomic cavity in veiled and panther chameleons. Our results could be used as a reference for future research studies or comparison of clinically ill patients. Keywords: Reptile, Lizard, Chameleon, Anatomy, Imaging. IntroductionDiagnostic imaging has been included in the diagnostic protocols of reptile medicine for decades. Radiographic studies and ultrasound examinations are well-established as diagnostic imaging tools in humans and veterinary patients like reptiles. However, the presence of shells, scales, and overlying structures have been historically limiting factors for the acquisition and interpretation of diagnostic images in reptile patients using these techniques (Gumpenberger, 2019a). The introduction of computed tomography (CT) has revolutionized the practice of diagnostic imaging in reptiles. The use of CT studies also allows a better interpretation of the images, above all in the chelonia group, where the shell can hamper the assessment of the coelomic cavity. Information related to normal anatomical descriptions in some species using advanced imaging techniques is limited (Gumpenberger and Henninger, 2001; Sochorcová et al., 2017; Sharma and Wyneken, 2019). CT has been used in the evaluation of diseases in the skeletal system, respiratory tract, reproductive tract, liver, spleen, and urinary tract in loggerhead sea turtle (Caretta caretta) (Arencibia et al., 2006; Valente et al., 2007), in different snakes species: Python regius, Boa constrictor, Python reticulatus, Morelia viridis, Epicrates cenchria, and Morelia spilota (Pees et al., 2009), in captive green iguanas (Iguana iguana) (Nardini et al., 2014), boas (Boa constrictor) (De Souza et al., 2018), sea turtles (Oraze et al., 2019), and other species (Schmidt et al., 2020). In exotic veterinary practice, veiled chameleon (Chamaeleo calyptratus) and panther chameleon (Furcifer pardalis) are the most popular pet chameleon species presented to visit in Spain. According to our review of the literature, few descriptions of normal CT and macroscopic cross-sectional anatomy characteristics description of F. pardalis have been previously described (Sharma and Wyneken, 2019). This study was designed with two objectives. First, to describe CT features of the coelomic organs in healthy patients, and second, to provide references of normal biometry in these species. Materials and MethodsStudy populationThis was a prospective, anatomic, and diagnostic imaging descriptive study. The inclusion criteria required only healthy animals and all used specimens were considered healthy by complete physical examination performed by two of the authors (JM and AM) and coprology analysis results confirming that all chameleons used in the study were free of protozoans. Seventeen veiled chameleons (7 males and 10 females) and 15 panther chameleons (13 males and 2 females) from a pet shop were used for the study purpose. The owner of the pet shop permitted the use of animal data for research aims. The study protocol was reviewed and approved by the “Comissió d’Experimentació Animal-Generalitat de Catalunya” CEA-OH/9203/1. The animals were housed in groups of two or three in separate terrariums equipped with ultraviolet-B lights and heat bulbs for a standardized time of 3 days before obtaining the CT images. The ambient temperature was approximately 28°C–30°C during the day, and 22°C–24°C at night. Humidity was provided with a watering artificial rain system for a minute every hour, 8 hours a day. The lighting cycles were of 14 hours of light and 10 hours of darkness. The animals were fasted for 48 hours before diagnostic imaging (based on gastrointestinal transit time previously described on bearded dragons) to ensure that the gastrointestinal tract was empty (Grosset et al., 2014). Coelomic ultrasound was performed the CT study to describe the appearance of the celomic organs and has been previously published (Melero et al., 2020). Computed tomographyA coelomic cavity CT study was performed on each animal. CT was performed once in each animal. Each animal was under light anesthesia using alfaxalone (Alfaxan® 10 mg/ml; Dechra, Worcestershire, UK) with intravenous administration directly using a 26-gauge butterfly catheter into the caudal vein, at a dose of 4–6 mg/kg (Knotek et al., 2011) in healthy veiled chameleons. The animals were maintained with gloves filled with warm water during anesthesia. The CT examinations were performed with a 16-slice helical CT scanner (General Electric Brivo CT 385) in cranio-caudal direction with the animals positioned in ventral recumbency (Fig. 1). All studies were obtained with a slice thickness of 0.625 mm, interval thickness of 0.625 mm, collimation pitch of 0.5625:1, 120 kV, 80 mA, field of view of 20 cm and a matrix of 512 × 512. The transverse images were reconstructed in sagittal and dorsal planes using multiplanar reconstruction. CT images were displayed in a soft tissue window (window level: 350; window width: 40) and a lung window (window level: −500; window width: 1,500). Coelomic organs height and width were assessed on the transverse images and length was assessed on the sagittal and dorsal reconstructions (Fig. 2).
Fig. 1. Panther chameleon (F. pardalis) under alfaxalone anesthesia positioned in sternal recumbency during the CT study.
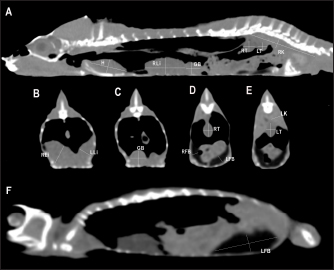
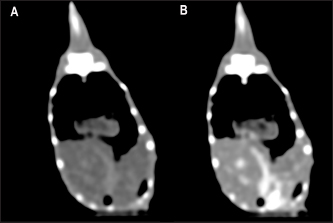
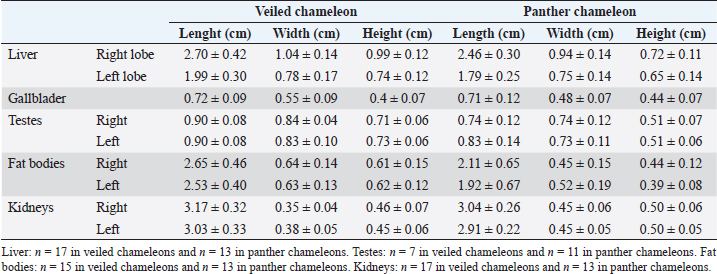
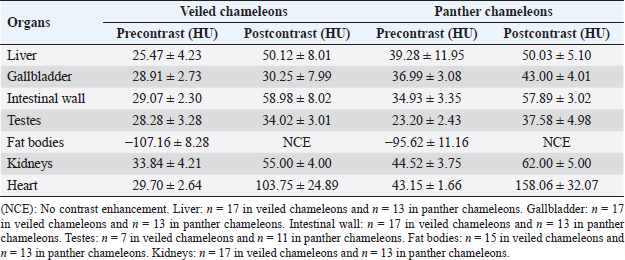
Fig. 2. Sagittal precontrast CT images displayed in soft tissue window (A and F) with length and height measurements of heart, liver, gallbladder, testes, kidneys, and fat bodies in a veiled chameleon (C. calyptratus). The precontrast CT transverse images displayed in soft tissue windows B–E show the width and height measurements of the same organs. H, heart; RLi, right liver lobe; LLi, left liver lobe; GB, gallbladder; RK, right kidney; LK, left kidney; RT, right testicle; LT, left testicle; RFB, right fat body; and LFB, left fat body. Nonionic iodinated contrast medium (iobitridol, Xenetix® 300 mg/ml, Guerbet, Madrid, Spain) was administered at a dose of 600 mg/kg directly into the caudal vein through an intravenous 26-gauge butterfly catheter. Postcontrast image series were obtained at 30 seconds and 1 minute after contrast administration. All data were transferred to a workstation and analyzed using a medical image viewer (RadiAnt DICOM Viewer version 4.6.9, 64-bit). Visibility, attenuation, location, anatomic landmarks, and size were registered for each organ. Attenuation values of the coelomic organs were measured in Hounsfield units (HUs), using a circular/ovoid region of interest (ROI) on the images of every organ following the same protocol previously used in small animals (Bertolini et al., 2006; Mallol et al., 2020). One measurement was performed for each organ in the precontrast and postcontrast study. The image with the largest cross-sectional area of tissue was selected in one of the series in transverse or dorsal planes. The ROI included one-third to one-half of the area of the organ in the selected image. This ROI area was located between series manually with the maximum approximation possible. Anatomical postmortem studyOne naturally dead specimen of each chameleon species, with permission of the owner, was donated to scientific research and conserved frozen. These animals did not show abnormal macroscopic findings in the coelomic organs and were used to illustrate coelomic anatomy and to assess imaging findings. They were sectioned using an electric saw to correspond with the CT images. All sections were cleaned and photographed (Zwart, 1990). The CT studies of these two chameleons were performed pre and postcontrast during a period before the natural cause of death. Statistical analysisThe approach of boundary limits was performed using an individual confidence interval. These upper and lower reference limits were assessed by individual 95% confidence intervals of means (95% CI). In addition, descriptions of measurements of anatomic structures were conducted by median and their 95% CI and absolute range of them. The results will be shown using median ± SD. All statistical analyses were performed using standard software (SPSS Statistics, version 25.0). Ethical approvalThe study protocol was reviewed and approved by the “Comissió d’Experimentació Animal-Generalitat de Catalunya” CEA-OH/9203/1. ResultsA total of 17 veiled chameleons (7 males and 10 females) and 15 panther chameleons (13 males and 2 females) met the inclusion criteria for the study. Given the small sample number of panther chameleon females, the authors finally decided to exclude them from the study. The mean body weight ± SD of the animals included in the study was 102.0 ± 16.8 g for veiled chameleons and 141.8 ± 20.1 g for panther chameleons. The ages of both species ranged from 8 to 18 months. The contrast study was successfully performed in 27 out of 30 animals (15 veiled chameleons and 12 panther chameleons). However, accidental contrast extravasation occurred in three veiled chameleons and two panther chameleons, with contrast remaining adjacent to the injection site tissue. In the postcontrast study, the contrast enhancement was better observed at 1 minute than 30 seconds after contrast administration (Fig. 3). Therefore, 1-minute postcontrast images were used for the postcontrast attenuation measurements. Heart, liver, including caudal vena cava (CVC), hepatic vessels, and gallbladder, esophagus, stomach, intestines, cloaca, gonads, fat bodies, kidneys, and when distended, urinary bladder were identified in the CT images with the aid of the anatomical sections (Fig. 4). The spleen, pancreas, and adrenal glands could not be identified. Measurement values of the liver, testes, fat bodies, and kidneys observed in CT in veiled and panther chameleons are seen in Table 1. LungsDue to the air attenuation of both lung fields and air sacs, it was not possible to delineate well-defined limits between them in a soft tissue window, where they were visualized together as a large air-attenuating structure (Figs. 5 and 6). Air sacs occupy more than two-thirds of the dorsal coelom, and lung volume is wide variable depending on their degree of expansion. Because of this, no measurements for lung size were taken. With the lung window, the lung parenchyma in the prehilar portion of the lungs appeared as a thin, faintly outlined, homogeneous, and hypoattenuating area surrounding an air-filled cavity (Fig. 5); in the posthilar portion of the lungs, the parenchyma was barely visible. A transverse septum could be observed as a thin, hyperattenuating structure along the lungs. The caudal portion of the gas-attenuating structure corresponded to the air sacs (Fig. 6).
Fig. 3. The postcontrast CT transverse images displayed in the soft tissue window show better contrast enhancement in the hepatic section observed at 60 seconds (B) than at 30 seconds (A) after contrast administration. HeartThe cardiac silhouette was located in the most cranial portion of the coelomic cavity, within the rib cage, showing a sternal contact. It was identified as a soft tissue attenuation structure with a round shape on the transverse plane and a more oval appearance on a sagittal reconstruction (Fig. 7). This organ was better visualized after contrast administration displaying a high enhancement. However, differentiation between the heart chambers was not possible even on postcontrast sequences. Values of median HUs pre and postcontrast enhancement were obtained (Table 2). Measurements of cardiac size were made on a sagittal plane, similar to measurements previously described for obtaining vertebral heart score (VHS) for other species (Buchanan, 2000). Two measures were traced. A long axis is defined as the longitudinal measurement of the cardiac silhouette from the carina to the apex. The short axis was perpendicular to the long axis, defined as the measurement between the cranial and caudal margins of the cardiac silhouette at its maximum width. These total axes measurements were extrapolated to the number of thoracic vertebrae from the cranial edge of the fourth vertebra. A median VHS was calculated for each species (Table 3).
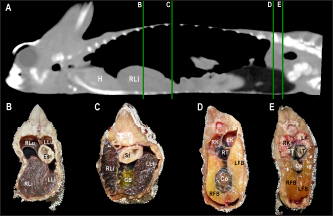
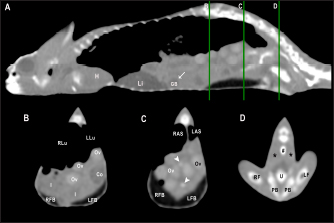
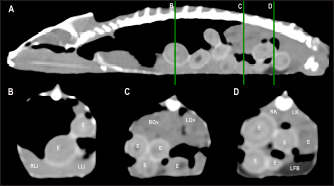
Fig. 4. Sagittal precontrast CT image displayed in soft tissue window (A) and transverse cross-sectional views of gross anatomical sections at the level of the liver (B), gallbladder (C), fat bodies (D), and kidneys (E) in a veiled chameleon (C. calyptratus). The right of the patient is on the left of the image. H, heart; RLu, right lung; LLu, left lung; Es, Esophagus; RLi, right liver lobe; LLi, left liver lobe; ST, stomach; GB, gallbladder; RK, right kidney; LK, left kidney; RT, right testicle; LT, left testicle; RFB, right fat body; LFB, left fat body; Co, colon. The posthepatic CVC segment (from the liver to the heart) was well visualized as a tubular longitudinal soft tissue attenuation structure with marked contrast enhancement localized on the most ventral aspect of the celomic cavity, slightly lateralized to the right side. The descending aorta was seen as a tubular structure, with a smaller diameter compared to the CVC, identified just ventral to the vertebral column, in the midline, and dorsal to the esophagus. Both great vessels were better recognizable on the postcontrast series, with a moderate to high contrast enhancement. LiverThe liver was correctly identified in all included specimens, and it was located in the cranio-ventral coelom. Its anatomical landmarks were cranially the cardiac apex, dorsally the lungs, and caudally the intestinal loops and fat bodies. Ventrally, the liver was in close contact with the ventral coelomic wall. The liver was observed as a structure with low soft tissue attenuating values and it was incompletely bilobed. The right lobe was larger than the left one (Figs. 5, 6, and 8). After contrast administration, the liver parenchyma showed homogeneous contrast enhancement. The hepatic veins and CVC were better defined from the adjacent parenchyma as a hyperattenuating tubular structure. The liver measurements are included in Table 1 and pre and postcontrast attenuation values are included in Table 2. Table 1. Measurement values (median ± SD) of liver, testes, fat bodies, and kidneys observed in CT in veiled and panther chameleons.
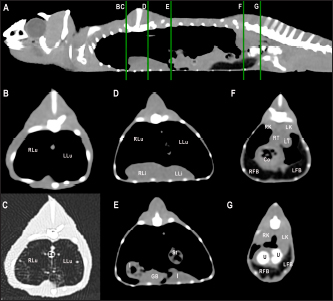
Fig. 5. Sagittal precontrast CT image displayed in soft tissue window (A) and selected corresponding transverse images represented as green line section, displayed in soft tissue (B, D–G) and lung window (C) at the level of the lungs, liver (D), gastrointestinal tract (E), fat bodies (F), and kidneys/urinary bladder (G) in a panther chameleon (F. pardalis). The right of the patient is on the left of the image. RLu, right lung; LLu, left lung; Es, esophagus; RLi, right liver lobe; LLi, left liver lobe; St, stomach; I, intestine; GB, gallbladder; RK, right kidney; LK, left kidney; RT, right testicle; LT, left testicle; Co, colon; RFB, right fat body; LFB, left fat body; U, urinary bladder with intraluminal content (urate salts) in the lumen visualized as multiple irregular mineral attenuating structures.
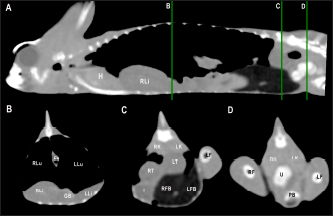
Fig. 6. Sagittal right paramedian precontrast CT image displayed in soft tissue window (A) and selected corresponding transverse images represented as green line section, displayed in soft tissue window at the level of the gallbladder (B), fat bodies (C), and kidneys/urinary bladder (D) in a veiled chameleon (C. calyptratus). H, heart; RLu, right lung; LLu, left lung; Es, esophagus; RLi, right liver lobe; LLi, left liver lobe; GB, gallbladder; RK, right kidney; LK, left kidney; RT, right testicle; LT, left testicle; I, intestine; RFB, right fat body; LFB, left fat body; U, urinary bladder; LF, left femur; RF, right femur; PB, pelvic bone.
Fig. 7. Sagittal right paramedian postcontrast CT image displayed in soft tissue window (A) and selected corresponding transverse images represented as green line section, displayed in soft tissue window, at the level of intestines (B), fat bodies and ovaries (C), and urinary bladder (D) in a female veiled chameleon (C. calyptratus). H, heart; GB, gallbladder; arrow, enhancement of the gallbladder; RLu, right lung; LLu, left lung; Ov, ovaric follicles; Co, colon; I, intestine; RFB, right fat body; LFB, left fat body; RAS, right air sac; LAS, left air sac; arrowhead, ovarian vessels; #, caudal vein; *, Li, liver; kidneys; U, urinary bladder; RF, right femur; LF, left femur; PB, pelvic bone. GallbladderThe gallbladder could be identified in the caudoventral border of the liver, between the two lobes, located in the ventral aspect of the medium coelom. It was slightly lateralized to the right side of the body and the intestinal loops and fat bodies were its caudal landmark. The gallbladder was observed in all veiled and panther chameleons as a fluid attenuating circular structure (Figs. 5 and 6) with no visible wall in precontrast images. In postcontrast images, the thin wall of the gallbladder enhanced homogeneously, and the content was hypoattenuating in comparison with the liver parenchyma (Fig. 7). Gallbladder measurements are provided in Table 1 and attenuation values in Table 2. Gastrointestinal tractThe esophagus (Figs. 5 and 6) was visualized in all animals and located dorsal to the liver, being visible as a tubular structure with soft tissue attenuation that was continuous with the stomach caudally. The stomach was visible as a tubular and elongated soft tissue attenuation structure. In all animals, it was slightly distended with mixed fluid and gas content (Fig. 5). Table 2. Measurements of pre and postcontrast attenuation values (median ± SD) of liver, gallbladder, intestinal wall, testes, ovarian follicles, fat bodies, and kidneys.
Table 3. Measurement values (median ± SD) of heart and VHS observed in CT in veiled and panther chameleon.
The intestines were found in the caudoventral coelomic cavity, between the liver cranially, the lungs craniodorsally, and the kidneys, gonads, and pelvis caudodorsally. The intestines were visualized in all animals. Intestinal loops were seen as tubular structures with a soft tissue attenuation wall and with intraluminal small gas bubbles (Figs. 5–7). However, the different intestinal segments could not be identified. Only the colon could be differentiated with gas or feces when it was distended (Fig. 5). Pre and postcontrast attenuation values can be consulted in Table 2. Finally, the cloaca was seen in 3 of 17 (17.6%) veiled chameleons and in 2 of 13 (13.3%) panther chameleons as an irregular mineral attenuating structure located in the caudoventral coelom within the pelvic bones. This attenuation is caused by the presence of urate salts located within the lumen, in the most caudal part of the pelvic canal (Figs. 6 and 7). GonadsThe testicles could be visualized in all male veiled chameleons (7/7; 100%) and in 11 of 13 (84.6%) male panther chameleons. The testicles were located in the caudo-dorsal part of the coelom ventral to the lumbar region. They were delimited ventrally by the intestines and fat bodies, caudally by the kidneys, and cranially by the lungs and the stomach. The right testicle was cranial to the left one (Figs. 5 and 6). These gonads were circular bilateral almost symmetrical homogenous soft tissue attenuating structures, mildly hypodense in comparison to the kidneys on plain images. They show mild diffuse contrast enhancement.
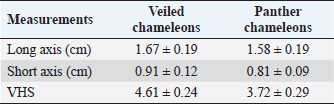
Fig. 8. Sagittal precontrast CT image displayed in soft tissue window (A) and selected corresponding transverse images represented as green line section, displayed in soft tissue window at the level of the liver (B), ovaries (C), and kidneys/fat bodies (D) in a female panther chameleon (F. pardalis). E, eggs; RLi, right liver lobe; LLi, left liver lobe; ROv, right ovary; LOv, left ovary; RK, right kidney; LK, left kidney; LFB, left fat body. The testicle measurements are included in Table 1. The attenuation values in pre and postcontrast images are shown in Table 2. The ovaries were identified cranial to the kidneys in 4 of 10 (40%) female veiled chameleons. They could be visualized as a cluster of multiple circular structures, the ovarian follicles, (with a grape-like appearance) with soft tissue attenuation in 2 of 10 (20%). Mild diffuse enhancement of these structures could be observed after contrast administration (Figs. 7 and 8). The diameter of the follicles ranged from 0.19 to 0.40 cm. When eggs were seen (2/10, 20%), they appeared as ovoid structures with alternating hyper and hypoattenuating layers (Fig. 8). The center of the egg had fluid attenuation and the peripheral line with mineral attenuation was the shell. The size of the eggs ranged from 0.56 to 0.80 cm in width and from 0.93 to 1.70 cm in length in veiled chameleons. The precontrast attenuation range of ovarian follicles was 25.5–39 HU in female veiled chameleons depending on the stage of follicle and egg development. The postcontrast attenuation range was 31.10–44.25 HU. Fat bodiesThe fat bodies could be visualized in 15 of 17 (88.2%) veiled chameleons and 13 of 13 (100%) panther chameleons. The fat bodies were located in the caudoventral part of the coelom, delimited cranially by the liver and lungs and caudo-dorsally by the kidneys and pelvis. They appeared as well-defined, fusiform, bilateral, and symmetrical homogeneous fat-attenuating structures (Figs. 5–8). They had a wide base in the ventral aspect and were narrow in the apical zone, with a triangular shape. The fat body measurements are included in Table 1 and the precontrast attenuation values are shown in Table 2. In postcontrast images, the fat bodies did not show enhancement. KidneysThe kidneys were visible in all animals. They were located in the caudodorsal coelom cavity, the cranial pole of the kidneys was limited dorsally by the spine, ventrally by the intestines, cranially by the gonads, and caudally by the pelvis. The caudal pole of the kidneys was seen within the pelvic canal. They appeared as lobulated oval and bilateral, symmetric structures with soft tissue attenuation (Figs. 5, 7, and 8). The kidneys were most easily identified in the sagittal plane and in the postcontrast studies, showing a diffuse heterogeneous contrast enhancement. The ureters could not be identified in any chameleon. The kidney measurements are provided in Table 1 and attenuation values in Table 2. Urinary bladderThe urinary bladder was seen in 8 of 17 (47.1%) veiled chameleons and in 4 of 13 (26.7%) panther chameleons. It was located in the caudoventral coelom and was visible as an oval structure delimited craniodorsally by the fat bodies and ventrally by the body wall. It was visualized in pre and postcontrast studies only in the animals that presented urate salts in the lumen as an irregular mineral attenuating structure (Fig. 5, 6 and 7). The size of the urinary bladder could not be determined due to the poor visualization of the wall. The attenuation range was wide and variable because it depended on the content and amount of urates. The range was 143–295 HU in veiled chameleons and 154–356 HU in panther chameleons. DiscussionIn the present study, all soft-tissue window transverse images were compared with their corresponding anatomical slice. The sectional anatomy of the coelomic organs in veiled and panther chameleons allows a correct morphologic and topographic evaluation of the anatomic structures, which is a useful tool for the interpretation of the CT images. All the CT study examinations were performed in sternal recumbency, similar to the previously described technique in other reptiles (Arencibia et al., 2006; Pees et al., 2009; Banzato et al., 2013). Unlike ultrasound, where lateral recumbency is recommended, for CT in reptiles the sternal recumbency is the chosen positioning, regardless of the animal shape, flattened or not, as previously described in other studies in loggerhead sea turtles (Caretta caretta), green iguana, and bearded dragon (Pogona vitticeps) (Valente et al., 2007; Banzato et al., 2013; Melero et al., 2020). In radiography, the overlap of structures happens not only in flattened patients but impairs the correct identification of the coelomic organs with similar soft tissue opacity due to border effacement between them. Using CT, this radiographic drawback is avoided, enabling separate visualization of each anatomical structures, which is even easier to achieve in postcontrast studies. In the current study, CT allowed proper identification of the coelomic structures without artifacts caused by gas from the lungs, air sacs, or intestines, as it happens in ultrasonography (Melero et al., 2020). In the present study, animals were under light anesthesia for restrain for diagnostic imaging purposes in order to avoid motion, but also to minimize the stress of handling, which is proven that can increase mortality in reptile species (Rossi, 2006; Kiefer and Pees, 2011) and reduce the risk of injuries and accidents. Restriction handling procedures for diagnostic imaging purpose is very unlikely to result in mortality in reptiles. The contrast study was successfully performed in 27 out of 30 animals (15 veiled chameleons and 12 panther chameleons). However, in five chameleons (three veiled chameleons and two panther chameleons), a small amount of extravasated contrast remained in the tissue surrounding the injection site due to the small diameter of the caudal vein, making this a challenging procedure. The presence of contrast in the perivascular soft tissues did not cause any adverse effects and did not hinder the interpretation of the images. The contrast enhancement was better visualized after 1 minute of the administration due to the low heart rate of these species. These results agree with the study of Nardini et al. (2014). In green iguana, the contrast medium was observed in the CVC 3 seconds after injection, but not in the aorta. Thirty-six seconds after injection the contrast was visible in the liver parenchyma, and after 600 seconds the contrast was still mildly appreciable in the liver (Nardini et al., 2014). As expected, the parenchymal organs enhanced after contrast administration. In the same way that was described for captive green iguanas (I. iguana) (Nardini et al., 2014), no side effects were observed in any animal. Using CT in healthy veiled and panther chameleons, the liver, including CVC, hepatic vessels, and gallbladder, esophagus, stomach, intestines, cloaca, gonads, fat bodies, kidneys, and when distended, the urinary bladder can be easily visualized. Other organs such as the spleen, pancreas, and adrenal glands, because of their small size, could not be seen in the CT examination in any animal in the current study. Instead, these organs were well-identified in anatomical postmortem studies (Melero et al., 2020). In other species such as the green iguana (I. iguana) and the black and white tegu (Tupinambis merianae) the spleen could be identified in CT as a small, rounded, soft tissue density, partially silhouetting with the stomach. Only in the green iguana the pancreas was identified in CT as a soft tissue density interposed between the small intestinal loops (Banzato et al., 2013). The lung parenchyma was described as a homogeneous meshlike or reticular and hypoattenuating area around an air-filled cavity, similar to other reptiles such as the bearded dragon, black and white tegu, ball python (Python regius), and boa constrictor (Boa constrictor) (Pees et al., 2009; Banzato et al., 2013). The transverse septum between the lungs could also be identified, in accordance with what has been described in the green iguana (Banzato et al., 2013). The lung parenchyma and the air sacs can be clearly observed using a lung window. Only lung reconstruction is recommended in order to evaluate these structures. The liver was encapsulated, incompletely bilobed and the right lobe was the largest of the two lobes. Similarly, in a study in black and white tegu and bearded dragon, a liver lobe extending caudally in a dorsolateral position was evident on the right side of the coelomic cavity (Banzato et al., 2013). Comparing the liver attenuation values with other previous studies in green iguanas (Nardini et al., 2014), interesting and relevant differences were found given the fact that basal liver attenuation in iguanas was higher (77.3 ± 6.2 HU) than the postcontrast HU- values achieved for the chameleons included in our study. This difference between species could be explained by different liver parenchyma composition or fatty deposition in chameleons but a histological comparative study would be necessary to compare it and find correlations. The gallbladder was easily identified as in previous studies in reptiles (Banzato et al., 2013). The attenuation of intraluminal content can vary according to the diet, and the presence of bile sludge or debris. Similar findings have not been found in CT studies of other reptiles in the reviewed literature. However, changes in echogenicity, likely representing the same variations, have also been described using ultrasonography in chameleons and other reptiles (Martorell et al., 2004; Bucy et al., 2015; Melero et al., 2020). Gallbladder size variability was observed among the chameleons of the study. This fact can be explained by the composition of the diet, the degree of contraction, blockage of parasites (such as Cryptosporidium sp., Choleimeria sp.), and even the length of fasting (Al-Quraishy, 2011; Azeez et al., 2014; Melero et al., 2020). The specimens included in this study were provided with the same type of food and fasting times. The stomach was identified in the craniodorsal coelom when it was distended with an elongated and tubular shape in the chameleons of this study. In contrast, the stomach had a C-shaped appearance in the green iguana and the black and white tegu (Banzato et al., 2013). The intestines were localized immediately caudoventral to the liver. The intestinal segments could not be differentiated due to the similar appearance along the gastrointestinal tract as in bearded dragons, and black and white tegu (Banzato et al., 2013). As in other reptile CT studies, the gastrointestinal wall stratification could not be differentiated, most probably due to the small size of the patients and the technical limitations of spatial resolution. In dogs and cats, gastrointestinal wall layers are visible in CT only in 22% of gastrointestinal segments, most often in the stomach and jejunum (Wisner and Zwingenberger, 2015). However, the recommended technique for a proper evaluation of gastrointestinal layering in chameleons is ultrasonography (Melero et al., 2020). The colon and cloaca could be identified when distended with content. However, when the colon was empty, the identification was not possible because its attenuation was similar to the adjacent soft tissues. The cloaca was only identified when it contained urate salts, which were observed as mineral attenuating structures. The gonads were easily visualized especially in reproductive mature animals. In males, although not specifically evaluated in this study, there was no evidence of differences in size or appearance of the testes during the study; even among animals of different body weights in different seasons. The lack of variation even between seasons could suggest that these species are sexually active throughout the year when environmental conditions in captivity are favorable. More studies would be necessary to understand the variation in the size and shape of testicles over time in chameleons. The ovaries were clearly identified in sexually active veiled chameleon females and the appearance was similar to those in other species (Gumpenberger, 2019a). The inactive ovaries could not be visualized (6 of 10, 60%). The CT images of the active ovaries allowed identification of the different stages of folliculogenesis. When the ovaries were in the initial stages of folliculogenesis the follicles appeared as circular structures with soft tissue attenuation and presented variable sizes. In the final stages of development, eggs were identified as delimited ovoid structures with an alternating hyper and hypoattenuating layer. The appearance of chameleons’ follicles and eggs in CT is in general similar to that of CT in bearded dragons and chelonians (Gumpenberger, 2019a, 2019b). The CT study offers a much larger grayscale and is not limited by superimposition, each follicle, and egg is detected and clearly evaluated, except the least developed follicles. In the last phases of development, the eggs could occupy two-thirds of the coelom, displacing the adjacent structures and especially causing lung compression. The fat bodies were easily identified because of the lower attenuation values (fat HU) in comparison with the adjacent structures. In general, the chameleons of the study had large fat bodies, but the size depended on multifactorial conditions such as the diet, physiological or reproductive status, and the presence of disease (Oldham-Ott and Gilloteaux, 1997). The CT study facilitated the evaluation of the entire kidneys in the chameleons of the study. Because the caudal poles of the kidneys are located in the pelvic canal, they cannot be completely observed using other imaging techniques such as radiography or ultrasonography. It is well known that CT allows the visualization of viscera avoiding the interferences and overlapping of different structures. In the current study, kidney attenuation was similar to the adjacent soft tissue structures. Therefore, the identification of the kidneys was easier in the sagittal than in the transverse plane and after contrast administration. The presence or absence of the urinary bladder depends on the family and gender of the reptiles. In veiled and panther chameleons, both genders have a urinary bladder (Oldham-Ott and Gilloteaux, 1997; Rossi, 2006; Valente et al., 2007). Similar to the cloaca, the urinary bladder was only identified in our study when it was distended with mineral attenuating structures in the lumen, corresponding to urate salts. The measurements of the urinary bladder size could not be performed due to the low contrast between the urinary bladder and adjacent tissues. In addition, the thin wall of the urinary bladder was not identified. In contrast with what was found in red-eared terrapins where enhancement of the ureters in postcontrast studies was considered excellent in all terrapins (Sochorcová et al., 2017), visualization of ureters was not possible in either of our specimens, probably due to CT spatial resolution related to the difference in animal size (average body weight of 1.16 ± 0.25 kg for the Trachemys scripta elegans compared to 102.0 ± 16.8 g for veiled chameleons and 141.8 ± 20.1 g for panther chameleons in our study). One of the most important limitations of this study was the few female numbers in the sample population of panther chameleons (only two specimens). For this reason, the authors decided to exclude these animals from the results. Of the 10 veiled chameleon females, different stages of breeding were found, with the assumption that 60% were nonbreeding phases given the fact that ovaries were not visualized. Other limitations of this study were age and size wide ranges between specimens. This fact should be taken into consideration when applying the information of this study to other animals. The chameleons were considered healthy based on the results of a complete physical examination and coprology findings. However, the presence of a subclinical disease is not uncommon (Garner, 2006). Blood analyses would give more information about the clinical status of the animal. However, they were not performed in the present study because the owner of the animals did not allow blood sampling. In conclusion, this study provides a guide to the normal cross-sectional and computed tomographic anatomy of the coelomic cavity in veiled chameleons and panther chameleons. Findings can be used as a reference for future research studies or examination of clinically ill patients, although comparative studies between healthy and diseased animals are still required. AcknowledgmentsThis work and the research behind would not have been possible without the exceptional support of Marc Navarro Beltran and the Department of Animal Health and Anatomy (Universitat Autònoma de Barcelona) and Albert Martínez Silvestre of the Catalonian Reptiles and Amphibians Rehabilitation Center (CRARC). Conflict of interestThe Authors declare that there is no conflict of interest. FundingThere was no funding source for this study, and it was all a contribution from the authors. Data availabilityAll data supporting the findings of this study are available within the manuscript and no additional data sources are required. Author contributionsConceptualization and design: AMJ, JVM, and JMM; acquisition of data: AMJ, JVM, MEQ, RNT, and YEG; formal analysis and interpretation of data: AMJ and JVM; writing-original draft preparation: AMJ and JVM; writing-review and editing: AMJ, JVM, RNT, YEG, and JMM. All authors have read and agreed to the published version of the manuscript. AMJ and JVM are co-first authors. They contributed equally to this work. ReferencesAl-Quraishy, S. 2011. A new Choleoeimeria species (apicomplexa: Eimeriidae) infecting the gall bladder of Scincus mitranus (Reptilia: Scincidae) in Saudi Arabia. J. Parasitol. 97(6), 1125–1128. Arencibia, A., Rivero, M.A., De Miguel, I., Contreras, S., Cabrero, A. and Orós, J. 2006. Computed tomographic anatomy of the head of the loggerhead sea turtle (Caretta caretta). Res. Vet. Sci. 81(2), 165–169. Azeez, O.I., Meintjes, R. and Chamunorwa, J.P. 2014. Fat body, fat pad and adipose tissues in invertebrates and vertebrates: the nexus. Lipids. Health. Dis. 13(1), 71. Banzato, T., Selleri, P., Veladiano, I.A. and Zotti, A. 2013. Comparative evaluation of the cadaveric and computed tomographic features of the coelomic cavity in the green iguana (Iguana iguana), black and white tegu (Tupinambis merianae) and bearded dragon (Pogona vitticeps). Anat. Histol. Embryol. 42(6), 453–460. Bertolini, G., Furlanello, T., De Lorenzi, D. and Caldin, M. 2006. Computed tomographic quantification of canine adrenal gland volume and attenuation. Vet. Radiol. Ultrasound. 47(5), 444–448. Buchanan, J.W. 2000. Vertebral scale system to measure heart size in radiographs. Vet. Clin. North. Am. Small. Anim. Pract. 30(2), 379–393. Bucy, D.S., Guzman, D.S. and Zwingenberger, A.L. 2015. Ultrasonographic anatomy of bearded dragons (Pogona vitticeps). J. Am. Vet. Med. Assoc. 246(8), 868–876. De Souza, J.C., Fernandes, T.H., De Albuquerque, B.M. and Costa, F.S. 2018. Quantitative computed tomography of healthy adult boas (Boa constrictor). J. Zoo. Wildl. Med. 49(4), 1012–1015. Garner, M.M. 2006. Overview of necropsy and necropsy techniques. In Reptile medicine and surgery, 2nd ed. Eds., Mader, D. St Louis, MO: Saunders Elsevier, pp: 569–580. Grosset, C., Daniaux, L., Guzman, D.S., Weber, E.S., Zwingenberger, A. and Paul-Murphy, J. 2014. Radiographic anatomy and barium sulfate contrast transit time of the gastrointestinal tract of bearded dragons (Pogona vitticeps). Vet. Radiol. Ultrasound. 55(3), 241–250. Gumpenberger, M. 2019a. Diagnostic imaging of reproductive tract disorders in reptiles. Vet. Clin. North. Am. Exot. Anim. Pract. 20(2), 327–343. Gumpenberger, M. 2019b. Secrets within the Bony Box—inside view on chelonians (An Overview). EAVDI Yearbook 2019. Cambridge, UK: EAVDI Lt, pp: 29–54. Gumpenberger, M. and Henninger, W. 2001. The use of computed tomography in avian and reptile medicine. Sem. Avian. Exotic. Pet. Med. 10(4), 174–180. Kiefer, I. and Pees, M. 2011. Computed tomography (CT). In Diagnostic imaging of exotic pets, 1st ed. Eds., Krautwald-Junghanns, M., Pees, M. and Reese, S. Hannover, Germany: Schlütersche, pp: 358–367. Knotek, Z., Hrda, A., Kley, N. and Knotkova, Z. Alfaxolone anaesthesia in veiled chameleon (Chamaeleo calyptratus). In Proceedings 18. Annual Conference ARAV, 6-12/8/2011, Seattle, WA, 2011, pp 179–181. Mallol, C., Altuzarra, R., Espada, Y., Tobón, M.R., Serrano, E. and Novellas, R. 2020. CT characterisation of feline adrenal glands. J. Feline. Med. Surg. 22(4), 285–291. Martorell, J., Espada, Y. and Ruiz De Gopegui, R. 2004. Normal echoanatomy of the red-eared slider terrapin (Trachemys scripta elegans). Vet. Rec. 155(14), 417–420. Melero, A., Novellas, R., Mallol, C., Ríos, J., Martínez-Silvestre, A. and Martorell, J. 2020. Ultrasonographic appearance of the coelomic cavity organs in healthy veiled chameleons (Chamaeleo calyptratus) and panther chameleons (Furcifer pardalis). Vet. Radiol. Ultrasound. 61(1), 58–66. Nardini, G., Di Girolamo, N., Leopardi, S., Paganelli, I., Zaghini, A., Origgi, F.C. and Vignoli, M. 2014. Evaluation of liver parenchyma and perfusion using dynamic contrast-enhanced computed tomography and contrast-enhanced ultrasonography in captive green iguanas (Iguana iguana) under general anesthesia. Vet. Res. 10(1), 112. Oldham-Ott, C.K. and Gilloteaux, J. 1997. Comparative morphology of the gallbladder and biliary tract in vertebrates: variation in structure, homology in function and gallstones. Microsc. Res. Tech. 38(6), 571–597. Oraze, J.S., Beltran, E., Thornton, S.M., Gumpenberger, M., Weller, R. and Biggi, M. 2019. Neurologic and computed tomography findings in sea turtles with history of traumatic injury. J. Zoo. Wildl. Med. 50(2), 350–361. Pees, M., Kiefer, I., Thielebein, J., Oechtering, G. and Krautwald-Junghanns, M.E. 2009. Computed tomography of the lung of healthy snakes of the species Python regius, Boa constrictor, Python reticulatus, Morelia viridis, Epicrates cenchria, and Morelia spilota. Vet. Radiol. Ultrasound. 50(5), 487–491. Rossi, J.V. 2006. General husbandry and management. In Reptile medicine and surgery, 2nd ed. Eds., Mader, D. St Louis, MO: Saunders Elsevier, pp: 25–41. Schmidt, L., Di Girolamo, N. and Selleri, P. 2020. Diagnostic imaging of the reptile urinary system. Vet. Clin. North. Am. Exot. Anim. Pract. 23(1), 131–149. Sharma, A. and Wyneken, J. 2019. Computed tomography. In Mader’s reptile and amphibian medicine and surgery, 3rd ed. Eds., Divers, S. and Stahl, SS. St Louis, MO: Elsevier, pp: 560–570. Sochorcová, V., Proks, P., Cermáková, E. and Knotek, Z. 2017. Contrast-enhanced computed tomography in red-eared terrapins (Trachemys scripta elegans). Vet. Med. 62(12), 674–680. Valente, A., Cuenca, R., Zamora, M., Parga, M.L., Lavin, S., Alegre, F. and Marco, I. 2007. Computed tomography of the vertebral column and coelomic structures in the normal loggerhead sea turtle (Caretta caretta). Vet. J. 174(2), 362–370. Wisner, E. and Zwingenberger, A. 2015. Gastrointestinal tract. Atlas of small animal CT and MRI, 1st ed. Oxford, UK: Editorial Offices, pp: 538–550. Zwart, P. 1990. Echsen. In Krankheiten der Heimtiere. Eds., Gabrisch, K. and Zwart, P. Hannover, Germany: Schlütersche, pp: 809–858. | ||
| How to Cite this Article |
| Pubmed Style Melero A, Verdés J, Espada Y, Novellas R, Encinoso M, Martorell J. Computed tomography of the coelomic cavity in healthy veiled chameleons (Chamaeleo calyptratus) and panther chameleons (Furcifer pardalis). Open Vet J. 2023; 13(9): 1071-1081. doi:10.5455/OVJ.2023.v13.i9.2 Web Style Melero A, Verdés J, Espada Y, Novellas R, Encinoso M, Martorell J. Computed tomography of the coelomic cavity in healthy veiled chameleons (Chamaeleo calyptratus) and panther chameleons (Furcifer pardalis). https://www.openveterinaryjournal.com/?mno=113832 [Access: May 19, 2024]. doi:10.5455/OVJ.2023.v13.i9.2 AMA (American Medical Association) Style Melero A, Verdés J, Espada Y, Novellas R, Encinoso M, Martorell J. Computed tomography of the coelomic cavity in healthy veiled chameleons (Chamaeleo calyptratus) and panther chameleons (Furcifer pardalis). Open Vet J. 2023; 13(9): 1071-1081. doi:10.5455/OVJ.2023.v13.i9.2 Vancouver/ICMJE Style Melero A, Verdés J, Espada Y, Novellas R, Encinoso M, Martorell J. Computed tomography of the coelomic cavity in healthy veiled chameleons (Chamaeleo calyptratus) and panther chameleons (Furcifer pardalis). Open Vet J. (2023), [cited May 19, 2024]; 13(9): 1071-1081. doi:10.5455/OVJ.2023.v13.i9.2 Harvard Style Melero, A., Verdés, . J., Espada, . Y., Novellas, . R., Encinoso, . M. & Martorell, . J. (2023) Computed tomography of the coelomic cavity in healthy veiled chameleons (Chamaeleo calyptratus) and panther chameleons (Furcifer pardalis). Open Vet J, 13 (9), 1071-1081. doi:10.5455/OVJ.2023.v13.i9.2 Turabian Style Melero, Adrián, Judit Verdés, Yvonne Espada, Rosa Novellas, Mario Encinoso, and Jaume Martorell. 2023. Computed tomography of the coelomic cavity in healthy veiled chameleons (Chamaeleo calyptratus) and panther chameleons (Furcifer pardalis). Open Veterinary Journal, 13 (9), 1071-1081. doi:10.5455/OVJ.2023.v13.i9.2 Chicago Style Melero, Adrián, Judit Verdés, Yvonne Espada, Rosa Novellas, Mario Encinoso, and Jaume Martorell. "Computed tomography of the coelomic cavity in healthy veiled chameleons (Chamaeleo calyptratus) and panther chameleons (Furcifer pardalis)." Open Veterinary Journal 13 (2023), 1071-1081. doi:10.5455/OVJ.2023.v13.i9.2 MLA (The Modern Language Association) Style Melero, Adrián, Judit Verdés, Yvonne Espada, Rosa Novellas, Mario Encinoso, and Jaume Martorell. "Computed tomography of the coelomic cavity in healthy veiled chameleons (Chamaeleo calyptratus) and panther chameleons (Furcifer pardalis)." Open Veterinary Journal 13.9 (2023), 1071-1081. Print. doi:10.5455/OVJ.2023.v13.i9.2 APA (American Psychological Association) Style Melero, A., Verdés, . J., Espada, . Y., Novellas, . R., Encinoso, . M. & Martorell, . J. (2023) Computed tomography of the coelomic cavity in healthy veiled chameleons (Chamaeleo calyptratus) and panther chameleons (Furcifer pardalis). Open Veterinary Journal, 13 (9), 1071-1081. doi:10.5455/OVJ.2023.v13.i9.2 |

