


| Research Article | ||
Open Veterinary Journal, (2024), Vol. 14(1): 256-265 Original Research The usage of the autoregressive integrated moving average model for forecasting milk production in Egypt (2022–2025)Mohamed A. Omar, Fardos A. M. Hassan, Sara. E. Shahin and Marwa El-shahat*Veterinary Economic and Farm Management, Department of Animal Wealth Development, Faculty of Veterinary Medicine, Zagazig University, Zagazig, Egypt *Corresponding Author: Marwa El-shahat. Veterinary Economic and Farm Management, Department of Animal Wealth Development, Faculty of Veterinary Medicine, Zagazig University, Zagazig, Egypt. Email: marwaalshahat17 [at] gmail.com Submitted: 01/10/2023 Accepted: 15/12/2023 Published: 31/01/2024 © 2024 Open Veterinary Journal
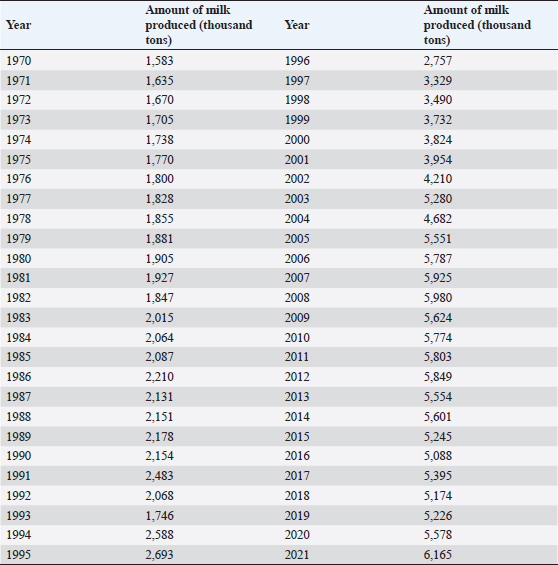
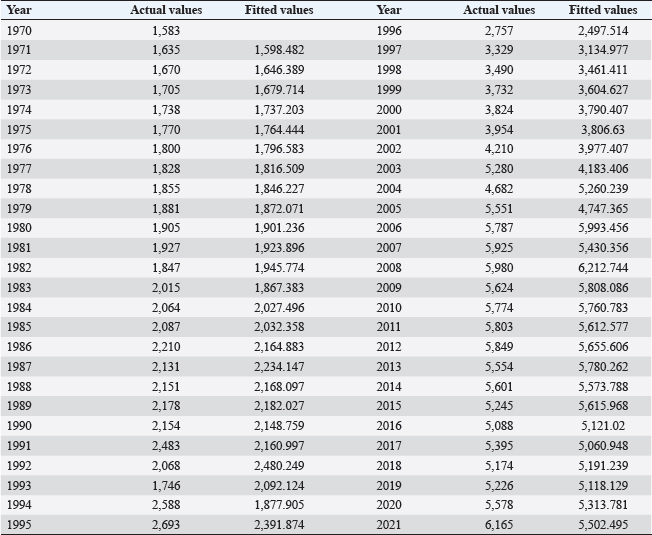
AbstractBackground: Milk is considered one of the most important capital goods and essential sources of animal protein in the diet of the Egyptian family, as well as an effective means to improve the economic condition of farmers, considering this important view, the policymakers need accurate and advance information regarding future supply for planning on the both short and long term. Aim: The study aims to forecast the production of milk in Egypt during the period from 2022 to 2025 using the Autoregressive Integrated Moving Average (ARIMA) model using time series data of milk production (MP) (1970–2021) obtained from the Central Agency for public mobilization and statistics (CAPMS). Methods: Augmented Dickey-Fullar Unit Root test, Partial autocorrelation function (PACF), and Autocorrelation function (ACF) of the time series sequence were used to judge the stationarity of the data. After confirming the stationarity of the data, the appropriate ARIMA model was selected based on certain statistical parameters like significant coefficients, values of adjusted R-squared, Akaike information criteria (AIC), Schwarz criterion (SC), and Standard Error of Regression. After the selection of the model based on the previous parameters, the verification of the model was employed by checking the residuals of the Correlogram-Q-Statistics test. Results: The most fitted model to predict the future levels of MP in Egypt was ARIMA (1, 1, and 3). Conclusion: Using the ARIMA (1, 1, 3) model, it could be forecasted that the production of milk in Egypt would show an increasing trend from 6,152.606 thousand tons in 2022 to 6,360.829 thousand tons in 2025. Keywords: Milk production, ARIMA, Forecasting, Egypt. IntroductionAnimal production projects in general, and dairy production in particular, are considered one of the most important pillars of providing an essential source of animal protein in the diet of Egyptian family, as well as an effective means to improve the economic, environmental, and agricultural conditions of farmers (Arafat et al., 2018). Milk makes a significant contribution to the body’s requirements for calcium, magnesium, selenium, riboflavin (B2), cobalamin (B12), and pantothenic acid (B5) vitamins. As a result, milk is the closest thing to ideal since it contains the majority of the elements that support growth as well as the energy-giving components of fat, protein, and carbohydrates that meet the majority of the body’s nutritional needs (Mahrous, 2016). After Asian countries (India, Pakistan, and China), Egypt was the fourth-largest producer of buffalo milk (2.6 million tonnes) and the 37th-largest producer of cow milk (3.1 million tonnes) in the world in 2011–2012 (FAO, 2011, 2012). The amount of milk produced increased by 1% to 5,226 thousand tonnes in 2019 from 5,174 thousand tonnes in 2018 and by 6.7% to 5,578 thousand tonnes in 2020 from 2019 levels (CAPMS, 2020). There are many Egyptian dairy products in the list of the most important Egyptian food commodities exported to world markets. Where, Egyptian export for dairy products contributed a ratio of about 7.7% of the Egyptian agricultural and food exports in the period from 2013 to 2017 (FAO, 2018). The exports of dairy commodities in Egypt, especially cheese and its types, were around 1.1% of the value of world exports, classified 18th among the world’s exporting States (CAPMS, 2016). At the current time, Egypt has self-sufficiency in the dairy industry; however, this may not continue in the future. The people are expanding steadily, and there is an extraordinarily high demand for milk and milk products. It is important to predict how much milk will be produced in the future so that the right policy changes may be made to meet the rising demand. There are multiple forecasting approaches that can be used as exponential smoothing methods such as simultaneous equation regression models, vector autoregression (VAR), and autoregressive integrated moving average models (ARIMA). From these techniques, ARIMA and VAR are considered more appropriate for accurate and precise forecasting (Chaudhari and Tingre, 2013). The ARIMA model is considered one of the most common time series models and an incredibly precise model for short-term prediction. While some time series are made up of a variety of time-dependent random variables, the fundamental assumption of the model is that the overall variations in the time series follow specific patterns that may be roughly predicted by the associated mathematical model. By analyzing the mathematical model, it is likely to comprehend the structure and characters of time series and to make predictions with the lowest possible variance (Lihua Ma et al., 2018). The study aims to forecast the future levels of milk production (MP) in Egypt to assist decision-makers in developing strategies that will enhance the development of the dairy industry as well as, assess the precision of the ARIMA model in analyzing and forecasting time series MP data. Material and MethodsSource of dataTime series MP data (1970–2021) were obtained from CAPMS (Table 1) to forecast levels of MP in Egypt from the year 2022 to 2025 using the ARIMA model. Table 1. Data of MP in Egypt from 1970–2021 according to CAPMS.
Model descriptionIn econometrics, the ARIMA model is considered one of the most accurate models for time series analysis (Lihua Ma et al., 2018). ARIMA model designed in 1970 by Box and Jenkins, was frequently used to analyze time series data to identify trends and predict future values (Chaudhari and Tingre, 2015). The (ARIMA) models were frequently utilized in several studies. Sankar and Prabakaran, (2012) forecasted the production of milk in TamilNadu by Autoregressive (AR), moving average (MA), and (ARIMA) methods and discovered that ARIMA (1, 1, 0) was the best ARIMA model to forecast MP and predicted that the level of MP would rise from 5.96 million tonnes in 2008 to 7.15 million tonnes in 2015. Hossain and Hassan, (2013) used cubic and linear models to forecast egg, milk, and meat production in Bangladesh and found that the linear model is better for egg production while the cubic model is best for milk and meat. The analysis found that if the growth rates continue, the production of milk, meat, and eggs would be 4.55, 3.77, and 7,544.67 million tonnes, respectively, in the year 2015–2016, the chosen model was used for the following four years’ forecast with a 95% confidence interval. Mishra et al. (2020) concluded that ARIMA (0, 2, 1) and ARIMA (0, 1, 1) were respectively the most fitted models for predicting amounts of MP in India and Chhattisgarh. According to their research, milk output in India and Chhattisgarh is predicted to increase from 219.73 MMT in 2022 to 1.599 MMT in 2023. The ARIMA model consists of three parts (p, d, q), p means the number of autoregressive terms (AR), d is the number of times the series has to be differenced before it becomes stationary (I), and q the number of moving average terms (MA) (Deshmukh and Paramasivam, 2016). AR process of order (p) is represented as follows:
The dependent variable (i.e., the variable of interest) is forecasted based on the background of future values using an AR time series model. (I) means the integration demonstrating the order of a single integer, the number of differences is the order of a single integer (d) which is represented as follows:
where yt−1 and yt are lagged original series and original series, respectively. Moving Average process of order (q) is represented as follows:
MA estimates approaching observations of the dependent variable by including historical data from the white noise process (i.e., historical forecast errors). The common form of the ARIMA model of order (p, d, q) is represented as follows:
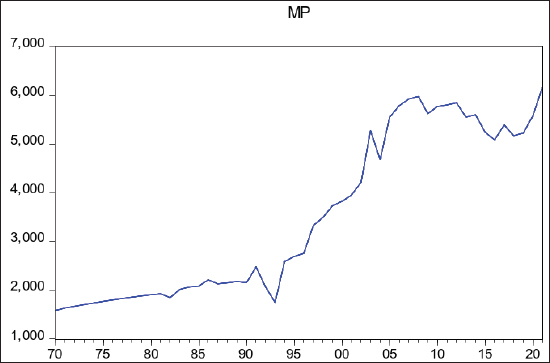
Where, Yt is milk production, ॉt are independently and normally distributed with zero mean and constant varience for t=1, 2,....., n; and Øp and θq are also estimated. The standard ARIMA model technique consists of four phases, including: I- Identification of model II- Parameter estimation (OLS) III-Diagnostic checking IV- Forecasting I-Identification of modelThe stationarity of the sequence must be checked before using the ARIMA model because nonstationary sequences cannot be predicted. The time series sequence’s scatter plot, line graph, partial autocorrelation function (PACF), and autocorrelation function (ACF) graphs are used for determining the sequence’s stationarity. The unit root of augmented Dickey-Fuller (ADF) is frequently used to examine the difference, trend, and seasonal variation and recognize the stationarity (Lihua Ma et al., 2018). If the time series is stationary, there is no need to take a single integer (D), and on this occasion, we can deal with the ARMA model (p, q). However, if the time series is not stationary, the proper conversions should be applied, such as logarithm and difference. To determine the values of the autocorrelation order p and the moving average order q of the ARIMA model, the sequence’s autocorrelation coefficient (ACF) and partial autocorrelation coefficient (PACF) are estimated. To find the most precise model, assume different values of p and q to obtain multiple ARIMA models. II-Parameter estimationUsing the least squares method (OLS) on EViews software, after determining the appropriate orders of p, d, q, we obtain multiple ARIMA models and select the most fitted model among them based on certain parameters such as significant coefficients, Akaike information criteria (AIC), adjusted R-squared, SC and Standard Error of regression (S.E. of regression). The most appropriate model for forecasting should have the most significant coefficients, the greatest adjusted R-squared value, and the lowest AIC, SC, and regression S.E. values. III-Diagnostic checkingThe selected model from Step II is analyzed and adjusted to test its accuracy by performing a Correlogram-Q-Statistics test on the residual. If the autocorrelations and partial autocorrelations of residuals at all lag nearly zero and all Q-Statistics are insignificant at a significance level of 0.05 this means that there is no serial correlation in the residuals and subsequent validity of this model for predicting future time series values. IV-ForecastingSelect the Forecast menu of the fitted model in the EViews software’s Equation window. In the dialog box, Dynamic or Static can be selected then click OK to obtain the predicted value (Lihua Ma et al., 2018). The primary metric of an ARIMA model’s realization depends on how well it forecasts both inside and outside of the sample period (Omar et al., 2022). ResultsModel identificationStationarity checkingThe MP data series during 1970–2021 is plotted in Figure 1.
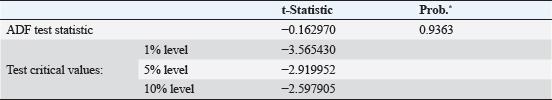
Fig. 1. The MP data from 1970 to 2021. Table 2. ADF test on MP.
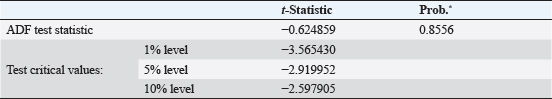
Table 3. ADF test on LMP.
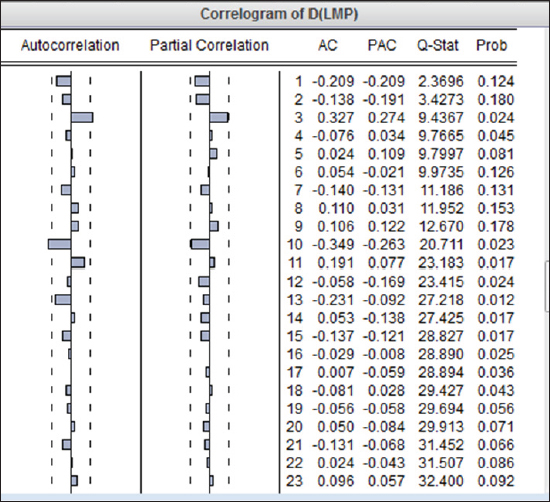
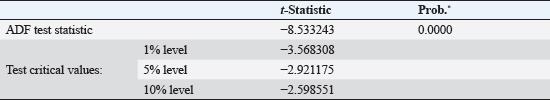
The probability of ADF statistic=0.9363 is greater than the threshold of 0.05, 0.01, and 0.1 significance levels (Table 2) Table 3 shows that the probability of ADF statistic of logarithm of milk production (LMP) is still higher than 0.05 for that, the null hypothesis cannot be rejected and the LMP series still has a unit rate. IdentificationIn Figure 2, with the EViews software, a correlogram test for LMP at the first-order difference is performed to get the graphs of the ACF and PACF of D (LMP) to calculate p and q values (ARMA terms), and as shown bands of partial correlation and Autocorrelation dropped to be nearly zero after lag 3. Therefore, p and q values can be supposed from 0 to 3. The result of the ADF test for DLMP is lower than 0.05 (Table 4).
Fig. 2. Graphs of ACF and PACF of the D (LMP) series. Table 4. ADF test on D (LMP).
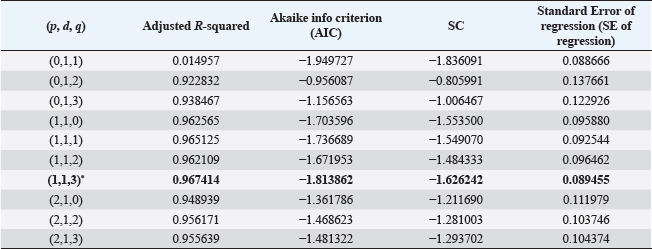
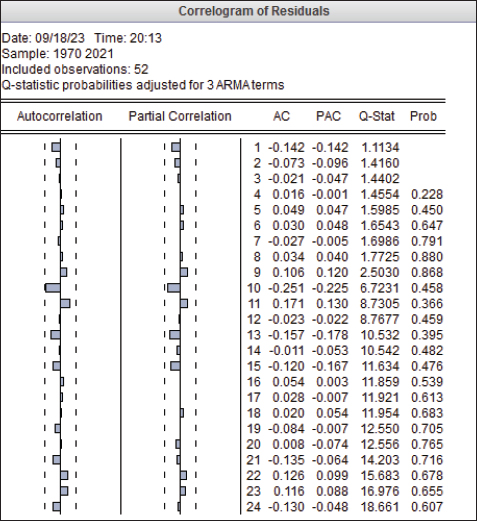
EstimationTable 5 demonstrates the consequences of the ARIMA test for multiple p and q parameters and d equal one. Diagnostic checkingThe model’s validation is concerned with examining the residuals of the selected model from the estimation step to certify the adequacy of the model for forecasting, this checking occurred through the Correlogram-Q-Statistics test and as seen in Figure 3, all Q-Statistics insignificant at a significance level of 0.05, and all bands of autocorrelation and partial correlation lay within confidence level which indicates that there is no serial correlation between residuals and validity of ARIMA (1, 1, 3) model. ForecastingThe fitted ARIMA model is used to perform two types of forecasts: Forecasting inside the sample period and Forecasting outside the sample period. DiscussionThe outcome of the Augmented Dickey-Fuller Unit Root test (ADF) on MP showed that the MP Sequence is nonstationary and the result of the ADF test proved that, the probability of ADF statistic=0.9363 is greater than the threshold of 0.05, 0.01, and 0.1 significance levels (Table 2), so the original sequence is exponential and to eliminate nonstationary pattern of sequence we take natural logarithm of the MP data to obtain LMP sequence and repeat ADF test on LMP sequence. Table 5. Results of the ARIMA (p, d, q) test.
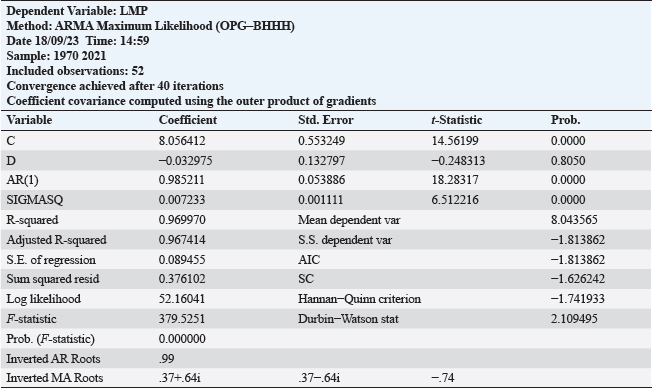
Fig. 3. Graphs of the ACF and PACF of the residual series. Table 6. The ARIMA (1, 1, 3) model’s estimation result.
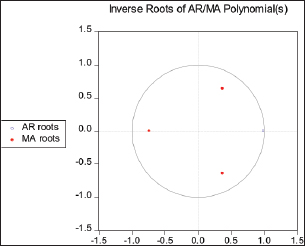
Furthermore, the first-order difference is performed on LMP to obtain the D (LMP) sequence which is exposed to ADF and the result of the ADF test for DLMP is lower than 0.05 (Table 4) so the D (LMP) sequence becomes stationary after the logarithmic change and the first-order difference. Notably, the most appropriate model to forecast the MP series was ARIMA (1, 1, 3) because this model had the greatest adjusted R-squared value and the lowest AIC, SC, and S.E. of regression values, and all statistical parameters of the model were statistically significant at a significance level of 5% as shown in (Table 6). In contrast, the findings obtained by Sankar and Prabkaran (2012), Chaudhari and Tingre (2013), and Lihua Ma et al. (2018) where all of them found that the most fitted model was ARIMA (1, 1, 0). In addition, Figure 4 reports the inverse roots of AR and MA characteristics, and as shown all AR and MA roots have a modulus of less than one and are found within the unit circle. This concerned another proof of the suitability and stability of the selected model.
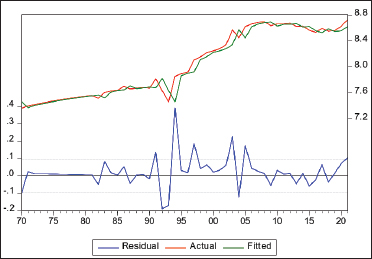
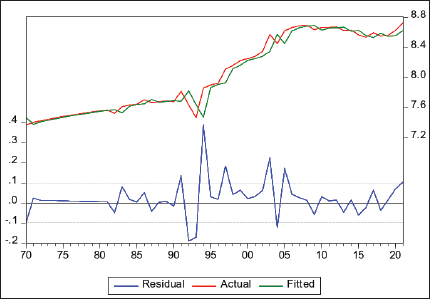
Fig. 4. The estimated inverse roots of AR and MA are stable (stationary). Finally, an ARIMA (1, 1, 3) model was used to fit the DLMP data, and the results are presented in Figure 5. The lower blue line represents the residuals, The red line represents the actual data and the green line represents the fitted data. The first is used to boost confidence in the model, and the latter is used to provide accurate forecasts for use in planning and other applications (Chaudhari and Tingre, 2015).
Fig. 5. Residual series, actual series, and fitted series of DLMP sequence. Table 7. Forecasting during the sample period.
Table 8. Forecasting outside sample period.
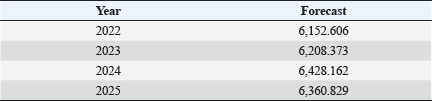
Fig. 6. The forecasting results (logarithmic values) of the MP from the year 2022 to 2025. Forecasting inside sample period: this type of forecast is obtained simply through plotting the actual series and fitted series of MP sequence as shown in Table 7. Forecasting outside sample period: based on the fitted ARIMA (1, 1, 3) model, the production of milk in Egypt was forecasted for the years 2022–2025, and the results are shown in Table 8 and Figure 6. ConclusionThe ARIMA (1, 1, 3) was found to be the most reliable and appropriate model to forecast future levels of MP in Egypt in the period from the year 2022 to 2025, and the results of forecasting indicated that MP would show an increasing trend from 6,152.606 thousand tons In 2022 to 6,360.829 thousand tons in 2025. AcknowledgmentsThe authors are grateful to the CAPMS in Egypt for providing the data that helped to complete this study. Authors contributionsThis research was conceptualized by Mohamed A. Omar. All authors participated in the study. All authors read and approved the final manuscript. Conflict of interestThe authors declare that they have no conflict of interest. FundingThis research did not receive any specific funding. Data availabilityThe manuscript contains the data necessary to understand the conclusions of the study. ReferencesArafat, M.A., Salim. S.E.A. and El-Sayed, M. 2018. Economics of dairy production in arid regions. Arab Universities J. Agri. Sci., 26(2B), 1275–1288. CAPMS. 2016. Central Agency for public mobilization and statistics: Bulletin of industrial statistics, for fiscal year 2015/2016, Issue No. (107), Ref. No. 71-01111-2016. Available via https://www.capmas.gov.eg/Pages/Publications.aspx?page_id=5104&Year=23565 CAPMS. 2020. Central Agency for public mobilization and statistics, statistical year book: Annual Bulletin of Statistics Livestock, Ref. No.71-22111-2020. Available via https://www.capmas.gov.eg/Pages/Publications.aspx?page_id=5104&Year=23466. Chaudhari, D.J. and Tingre, A.S. 2013. Forecasting of MP in India: an application of ARIMA model. Indian J. Dairy Sci., 66, 72–78. Chaudhari, D.J. and Tingre, A.S. 2015. Forecasting eggs production in India. Indian J. Anim. Res. 49(3), 367–372. Deshmukh, S.S. and Paramasivam, R. 2016. Forecasting of milk production in India with ARIMA and VAR time series models. Asian J. Dairy Food Res., 35(1), 17–22. FAO. 2011. Food and Agriculture Organization of the United Nations: FAOSTAT Statistics Database. Available via https://www.fao.org/3/i3107e/i3107e04.pdf. FAO. 2012. Food and Agriculture Organization of the United Nations: FAOSTAT Statistics Database. Available via https://www.fao.org/3/i2490e/i2490e00.htm. FAO. 2018. Food and Agriculture Organization of the United Nations: Report of the Organization for economic cooperation and development (OECD) in cooperation with the food and Agriculture Organization. Available via https://doi.org/10.1787/agr_outlook-2018-en. Hossain, J. and Hassan, F. 2013. Forecasting of milk, meat and egg production in Bangladesh. Res. J. Anim. Vet. Fish. Sci. 1, 7–13. Lihua, M., Chao, H., Rongchao, L. and Yanben, H. 2018. ARIMA model forecast based on EViews software. IOP Conference Series: Earth and Environmental Science, IOP Publishing. 208, 1755–1315. Mahrous, H.M. 2016. Milk production and its role in food security in Egypt. Inter. J. Pharm. Tech. Res. 9(12), 329–340. Mishra, P., Faith, C., Vani, G.K., Tiwari, S., Ramesh, D. and Dubey, A. 2020. Time series investigation of milk production in major states of India using ARIMA modeling. J. Anim. Res. 10(1), 77–84. Omar, M.A., Shahin, S.E. and Roshdy, M. 2022. Forecasting Inflation in Egypt (2019–2022) by using auto regressive integrated moving average (ARIMA) Models. J. Adv. Vet. Res. 12, 670–676. Sankar, T.J. and Prabakaran, R. 2012. Forecasting milk production in Tamil Nadu. Inter. Multidiscip. Res. J. 2, 10–15. | ||


| How to Cite this Article |
| Pubmed Style Omar MA, Hassan FA, Shahin SE, El-shahat M. The usage of the autoregressive integrated moving average (ARIMA) model for forecasting milk production in Egypt (2022-2025). Open Vet J. 2024; 14((1) (Zagazig Veterinary Conference)): 256-265. doi:10.5455/OVJ.2024.v14.i1.22 Web Style Omar MA, Hassan FA, Shahin SE, El-shahat M. The usage of the autoregressive integrated moving average (ARIMA) model for forecasting milk production in Egypt (2022-2025). https://www.openveterinaryjournal.com/?mno=177122 [Access: May 08, 2024]. doi:10.5455/OVJ.2024.v14.i1.22 AMA (American Medical Association) Style Omar MA, Hassan FA, Shahin SE, El-shahat M. The usage of the autoregressive integrated moving average (ARIMA) model for forecasting milk production in Egypt (2022-2025). Open Vet J. 2024; 14((1) (Zagazig Veterinary Conference)): 256-265. doi:10.5455/OVJ.2024.v14.i1.22 Vancouver/ICMJE Style Omar MA, Hassan FA, Shahin SE, El-shahat M. The usage of the autoregressive integrated moving average (ARIMA) model for forecasting milk production in Egypt (2022-2025). Open Vet J. (2024), [cited May 08, 2024]; 14((1) (Zagazig Veterinary Conference)): 256-265. doi:10.5455/OVJ.2024.v14.i1.22 Harvard Style Omar, M. A., Hassan, . F. A., Shahin, . S. E. & El-shahat, . M. (2024) The usage of the autoregressive integrated moving average (ARIMA) model for forecasting milk production in Egypt (2022-2025). Open Vet J, 14 ((1) (Zagazig Veterinary Conference)), 256-265. doi:10.5455/OVJ.2024.v14.i1.22 Turabian Style Omar, Mohamed A., Fardos A.M. Hassan, Sara. E. Shahin, and Marwa El-shahat. 2024. The usage of the autoregressive integrated moving average (ARIMA) model for forecasting milk production in Egypt (2022-2025). Open Veterinary Journal, 14 ((1) (Zagazig Veterinary Conference)), 256-265. doi:10.5455/OVJ.2024.v14.i1.22 Chicago Style Omar, Mohamed A., Fardos A.M. Hassan, Sara. E. Shahin, and Marwa El-shahat. "The usage of the autoregressive integrated moving average (ARIMA) model for forecasting milk production in Egypt (2022-2025)." Open Veterinary Journal 14 (2024), 256-265. doi:10.5455/OVJ.2024.v14.i1.22 MLA (The Modern Language Association) Style Omar, Mohamed A., Fardos A.M. Hassan, Sara. E. Shahin, and Marwa El-shahat. "The usage of the autoregressive integrated moving average (ARIMA) model for forecasting milk production in Egypt (2022-2025)." Open Veterinary Journal 14.(1) (Zagazig Veterinary Conference) (2024), 256-265. Print. doi:10.5455/OVJ.2024.v14.i1.22 APA (American Psychological Association) Style Omar, M. A., Hassan, . F. A., Shahin, . S. E. & El-shahat, . M. (2024) The usage of the autoregressive integrated moving average (ARIMA) model for forecasting milk production in Egypt (2022-2025). Open Veterinary Journal, 14 ((1) (Zagazig Veterinary Conference)), 256-265. doi:10.5455/OVJ.2024.v14.i1.22 |

