


| Research Article | ||
Open Vet. J.. 2024; 14(12): 3203-3212 Open Veterinary Journal, (2024), Vol. 14(12): 3203-3212 Research Article Post competition recovery of hydroelectrolytic and acid–base variables under distinct comfort indexes in equines participating in 90 km Federate RAIDGonzalo Marichal1*, Gonzalo Suárez2, Ana Meikle3 and Marcos Muriel41Unidad de Clínica y Cirugía de Equinos, Departamento Hospital y Clínicas Veterinarias, Facultad de Veterinaria, Universidad de la República, Montevideo, Uruguay 2Unidad de Farmacología y Terapéutica, Departamento Hospital y Clínicas Veterinarias, Facultad de Veterinaria, Universidad de la República, Montevideo, Uruguay 3Laboratorio de Endocrinología y Metabolismo Animal, Facultad de Veterinaria, Universidad de la República, Montevideo, Uruguay 4Centro de Fisiología y Fisiopatología del Equino Deportivo, Facultad de Ciencias Veterinarias, Universidad Nacional de La Plata, La Plata, Argentina *Corresponding Author: Gonzalo Marichal. Unidad de Clínica y Cirugía de Equinos, Departamento Hospital y Clínicas Veterinarias, Facultad de Veterinaria, Universidad de la República, Montevideo, Uruguay. Email: marichalgonzalo [at] gmail.com Submitted: 05/07/2024 Accepted: 29/11/2024 Published: 31/12/2024 © 2024 Open Veterinary Journal
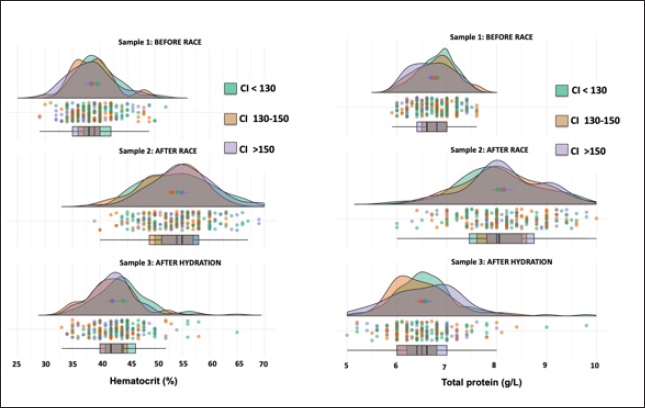
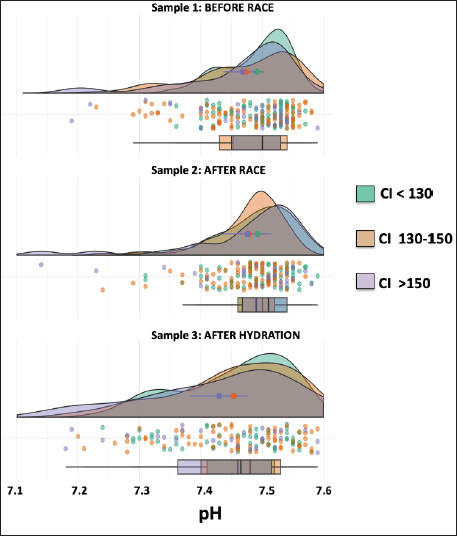
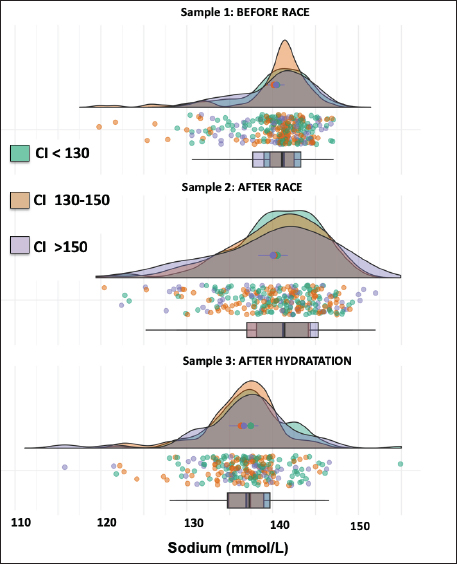
AbstractBackground: The recovery of acid-base and hydro electrolytic balance at medical discharge after Raid races and its association with comfort index (CI) is unknown. Aim: To determine hydroelectrolytic and acid–base variations before and at the time of clinical discharge in horses that completed 90 km Raid competitions. Methods: Hematocrit, total protein, sodium, potassium, chloride, calcium, and serum pH were determined in samples before and after the race and after hydration in 276 horses and were analyzed using a mixed procedure, including the time of the race, the CI and its interaction. Results: The hematocrit and total protein values after hydration showed a correction to normal values, however, while for total protein no differences were observed between this sample and before the race, the hematocrit at medical discharge was still higher than the sample before the race. The pH values after the race were higher than before the race and after hydration. Sodium concentrations before and after the race were higher than after hydration. Chloride and calcium concentrations before the race were higher than after the race and hydration. Potassium concentration was affected by the interaction between CI and sampling, as only in worse climate conditions, potassium concentrations after the race and hydration were lower than before the race. Conclusion: Most hydroelectrolytic and acid-base variables at the medical discharge did not reach the values before the race, but they were within the normal values. The CI was a non-explanatory source of variability for most variables in this study. Keywords: Horse, Sweat, Electrolyte concentration, Resistance. IntroductionThe Equestrian Raids are endurance competitions that take place over distances of 60–115 km with only 60 minutes rest at two-thirds of the race (F.E.U, 2021). In endurance, there is an important variability in race completion ranges (Nagy et al., 2010; Fielding et al., 2011; Younes et al., 2015; Muñoz-Alonzo et al., 2016; Bennet and Parkin, 2018). We recently reported that 61% of the 900 horses that competed in Raids did not finish the race (Marichal et al., 2023). Sweating causes a considerable loss of fluids and electrolytes, mainly potassium (K+) and chloride (Cl-). Homeostatic imbalances occur more frequently in endurance than in other equestrian sports (Marlin et al., 1996; Foreman, 1998; Flaminio and Rush, 1998; Lindinger, 2008; Fielding et al., 2009; Nagy et al., 2013; Poškienė et al., 2020). During exercise, due to significant chloride losses through sweat, bicarbonate is retained at the kidney level, which produces a hypochloremic metabolic alkalosis (Flaminio and Rush, 1998). Vigorous exercise in hot and humid conditions has been shown to produce greater electrolyte imbalance and dehydration than exercise in dry, cold conditions (Marlin et al., 1996; Lindinger, 2008), which can also lead to clinical metabolic problems (Flaminio and Rush, 1998). We have reported that the comfort index (CI) was not associated with success in completing the race (Marichal et al., 2023). On the other hand, while the CI was not associated with the hematocrit, pH, total plasma proteins, or sodium concentrations in blood samples taken after finishing the RAID, the decreases in chloride, potassium, and calcium concentrations found after the race was more pronounced at moderate and high CI values when compared with low CI values, indicating the importance of considering the impact of the CI on hydroelectrolyte losses. At the end of the endurance races, electrolyte replacement is carried out until the horses are clinically stable. In raids, although total proteins and hematocrit are usually determined together with the medical examination, the hydroelectrolyte balance is unknown. To the best of our knowledge, there are no data available on the recovery of acid-base and electrolyte balance after medical discharge in endurance races. The objective of the present study was to determine the hydroelectrolyte and acid-base recovery at the time of clinical discharge in horses that finished 90 km Raid competitions under distinct CI. Thus, to compare the recovery after hydration, blood samples were obtained at this moment as well as before and after the race. Materials and MethodsComfort indexThe Institute of Meteorology of Uruguay (Inumet, Uruguay) provided temperature (T, in degrees Fahrenheit) and humidity (H, in percentages) data at the beginning of each race. The CI was calculated using the following formula (Jones, 2009): CI=T (F) + H (%); three CI levels were identified: low (CI <130), moderate (CI 130–150), and high (CI >150). Animals and competitionsThe breeds included Arabian, Creole, Thoroughbred, and crossbreeds. Animals were at least 5 years old regardless of sex and health status and were free of locomotor, cardiorespiratory, and/or digestive disabilities or any other symptoms or injuries that, in the opinion of the official veterinarians, would endanger the life of the animal. In the pre-competition examination, clinical parameters, such as heart rate, respiratory rate, hydration status, intestinal motility, and capillary refill time were verified. A locomotor check was also performed, and the horse was examined for any evidence of lameness. The checks were carried out the day before the race between 11 a.m. and 1 p.m. by the same team of veterinarians certified by the FEU, who remained until the end of the race. When the animals finish the first stage (2/3 of the race), at rest, the veterinarians perform the same metabolic and locomotor tests as the previous day to monitor the health status of the horses and authorize those with parameters close to normal to continue the race (F.E.U, 2021). Long competitions are considered when the distances exceed 80 km (F.E.U, 2021). This study included only the 90 km (n=24) competitions between March and November (covering all seasons except summer) in different locations in the country, resulting in 276 horses that finished the races out of a total of 693 competitors. Blood samplesThe day before the competition, the horses were examined by veterinarians, who authorized horses that met the sanitary conditions required by the F.E.U to compete. In addition, a blood sample (sample 1, before the race) was aseptically obtained from the jugular vein using syringes (5 ml) and disposable needles (21G). Immediately after the race, another blood sample (sample 2) was collected. All horses were sent to the hospital, a delimited area where the official medical team is located, and the animals were treated until they recovered. Before receiving a medical discharge, the last blood sample was obtained (sample 3, after the race and hydration) using the same procedure mentioned above. For all samples, a portion of the sample was placed in tubes with EDTA (Sanli Medical, China), and the other sample was immediately transferred to tubes with a coagulation accelerator and Serotubpp gel separator (Sanli Medical, China), and centrifuged for 15 minutes at 3600 rpm (Rolco Model197, Argentina). The serum was transferred to Eppendorf microtubes. These were kept in an isothermal box with ice cubes for transport until refrigerated at 4°C, where they were stored until further processing in the laboratory within 48 hours after obtaining them. In blood samples mixed with EDTA, the hematocrit (Ht) was determined by the official veterinary laboratory by capillary centrifugation in a microcentrifuge, and total plasma protein concentrations were estimated by refractometry (Biriden, Uruguay). Determination of hydroelectrolytic and acid–base valuesSerum samples were analyzed at the Laboratory of Clinical Analysis of the Veterinary Hospital (Facultad Veterinaria, Universidad de la República). A high-performance specific ion electrode analyzer (HumaLyte plus 5 automatic, Germany) was used to determine the serum concentrations of sodium (Na+), potassium (K+), chloride (Cl-), total plasma calcium (tCa++), ionized calcium (iCa++), and serum pH. Statistical analysisDescriptive analyses of the hydroelectrolytic and acid–base values were carried out with the determination of the main cut-off values (mean and standard deviation (SD); 25th, 50th, and 75th percentiles, and individual values). Kruskal–Wallis rank sum test and Pearson’s chi-squared test were incorporated as the primary statistical analysis with the values of temperature, humidity, CI value and percentage for levels, and the completion status or stage for each race. The statistical differences between the samples in relation to the hydroelectrolytic and hematological variables were analyzed using linear mixed models, considering fixed effects (CI, sampling time, and interaction) and random effects (variable animals within the competition). Data is shown as means ± standard deviation. Statistical significance was set at p < 0.05. All analyses were performed in R (Version 4.1.2). Ethical approvalThis study was approved (number 111400-000124-12) by the Honorary Committee of Ethics and Animal Experimentation of Facultad de Veterinaria, Universidad de la República (Uruguay). This study was approved by the Uruguayan Equestrian Federation, owners, riders, and official and private veterinarians of Ministerio de Ganadería Agricultura y Pesca (MGAP, Uruguay). All procedures performed on the animals had the prior consent of their owners and were carried out under strict biosecurity procedures as well as under the supervision of those responsible for the study. ResultsIn the present trial, blood samples from 276 horses under different CI (112 horses in CI<130; 100 horses in CI 130–150 CI; 64 horses in CI>150) that competed in long events of 90 km (Raids) and managed to finish the race were evaluated (Supplementary Table 1). CI had no effect on any variables, and no interaction with the sample was found in most variables except in potassium concentrations that were significant. The density graph for each sample in different colors shows the CI for all cases (Figs. 1–6). The hematocrit results indicated an increase in the values at the end of the competition (mean ± SD, 54 ± 6 %; sample 2) and after hydration (43 ± 5 %; sample 3) with respect to the values before the race (39 ± 4 %; sample 1) (p < 0.05, Fig. 1). The hematocrit values after hydration were lower than at the end of the competition, showing a correction to normal values (p < 0.05, Fig. 1). Nevertheless, it was still greater than the sample before the race (sample 1) (p < 0.05, Fig. 1). Total protein in plasma increased between before and the end of the race (6.77 ± 0.39 vs. 8.12 ± 0.81 g/l, respectively; p < 0.05, Fig. 1) and levels returned to basal values after hydration, as no differences were observed in samples 1 versus 3 (6.77 ± 0.39 vs. 6.54 ± 0.64 g/l, respectively; p > 0.05). The variation observed in the sample after hydration (sample 3; as shown in the box and whisker plot and individual values) was greater than that in the sample before the race (sample 1). The pH values after the race (sample 2: 7.475 ± 0.013) were greater (p < 0.01) than before the race (sample 1: 7.436 ± 0.012) and after hydration (sample 3: 7.443 ± 0.012), and no differences were found between samples 1 versus 3 (Fig. 2). Sodium concentrations were affected by the sampling time, as concentrations were lower after hydration [137 ± 5 mmol/l (sample 3) vs. 140 ± 4.2 mmol/l (sample 1) and 140 ± 5.6 mmol/l (sample 2), p < 0.05, Fig. 3].
Fig. 1. Hematocrit (left panel) and protein (right panel) data. Individual values (dots) and density graph in samples 1 (before the race), 2 (after the race), and 3 (after rehydration). Different colors represent CI. The box and whisker plot show the median, upper and lower quartiles, and individual values.
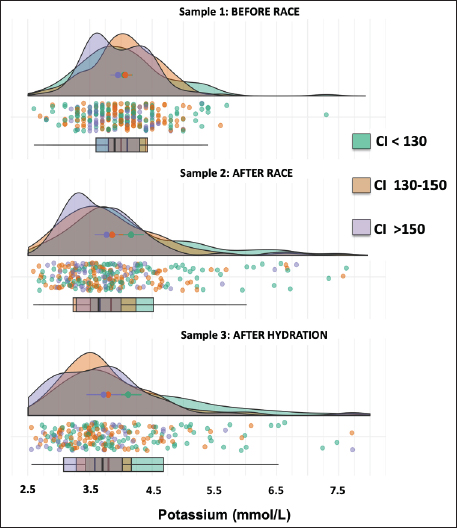
Fig. 2. Individual pH values (dots) and density graph of protein concentrations in samples 1 (before the race), 2 (after the race), and 3 (after rehydration). Different colors represent CI. The box and whisker plots show the median, upper, and lower quartiles, and individual values. Chloride concentrations were affected by the sample, as both samples after the race [94.4 ± 4.0 mmol/l (sample 2)] and hydration [97.4 ± 4.7 mmol/l (sample 3)] were lower than the sample before the race [104 ± 2.5 mmol/l (sample 1)] (p < 0.05). Moreover, there was a greater dispersion of the sample after the race and hydration than before the race, with the sample after hydration being closer to the initial values (p < 0.05) (Fig. 4). The total calcium concentrations were affected by the sample, as both samples after the race [2.85 ± 0.36 mmol/l (sample 2)] and hydration [3.11 ± 0.35 mmol/l (sample 3)] were lower than the sample before the race [3.25 ± 0.23 mmol/l (sample 1)] (p < 0.05, Fig. 5). The ionic calcium concentrations showed a similar pattern to the total calcium concentrations (data not shown). The interaction of the CI and the sample affected potassium concentrations (p=0.021), as only in CI 130–150, the sample before the race presented greater (p < 0.05) potassium concentrations than after the race and hydration (4.11 ± 0.15 for sample 1 vs. 3.87 ± 0.15 mmol/l and 3.83 ± 0.15 mmol/l for samples 2 and 3, respectively (Fig. 6). As for most electrolytes, there was a greater dispersion of the sample after hydration than before the race (Fig. 6). DiscussionTo the best of our knowledge, this is the first study that shows post-competition recovery of hydroelectrolyte and acid-base variables in 276 horses that finished 90 km endurance races out of a total of 693. The hematocrit and total protein values after hydration showed that hydration therapy in most horses was correct, since the values were lower than those obtained after finishing the race. It is interesting to note that only 3 hours after the race, total protein concentrations and hematocrit decreased by 20%, showing that the horse has a relevant capacity to restore the equilibrium of the internal media that was altered by high dehydration, mainly due to sweat (Hodgson et al., 1993).
Fig. 3. Individual sodium values (dots) and normal distribution of sodium concentrations in sample 1 (before the race), sample 2 (after the race), and sample 3 (after rehydration). Different colors represent CI. The box and whisker plot show the median, upper and lower quartiles, and individual values. The values of these variables were within the average value for the sport horse in this activity., according to the reported range values for the species (Marichal et al., 2023), which agrees with the fact that F.E.U veterinarians consider these values before they raise medical discharge for horses. The body adapts to physical demands to preserve homeostasis without causing significant damage at the organic or systemic level. Moreover, the biological response is related to the type of exercise and its duration (Bonilla, 2005), but also to horse adaptation due to its genetics and training. However, while total protein concentrations after hydration were completely restored when compared to values before the race, the Ht values were still greater (10% more than the initial values). This is in line with the differential increase in these variables after the race (38.5% increase in Ht and 20% increase in total proteins). The increase found in Ht even after hydration may be associated with stress due to exercise that results in the intense release of erythrocytes into the peripheral circulation (Saltin, 1988). Although after hydration—at the medical discharge—most of the hydroelectrolytic and acid-base variables did not reach pre-race values, the values were within normal ranges, reflecting the response to the treatments. The pH values had a subtle increase after the race (pH was greater than before the race), and metabolic alkalosis has been reported in endurance horses before (Corley and Stephen, 2008; Robert et al., 2010), which is related to chloride loss in sweat and pulmonary hyperventilation. Data shows that the buffer system of these athletes copes with this type of resistance race, even if horses are running without stopping for 60 km at a speed of approximately 28 km/hour. Moreover, the rapid restoration of the pH values after the race reflects the adaptation of the horses to this metabolic challenge.
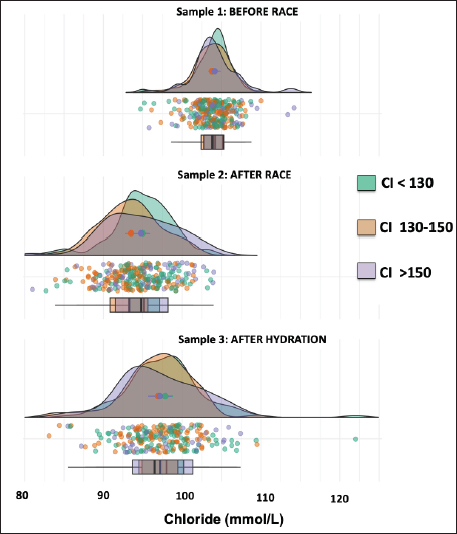
Fig. 4. Individual chloride values (dots) and normal distribution of chloride concentrations in sample 1 (before the race), sample 2 (after the race), and sample 3 (after rehydration). Different colors represent CI. The box and whisker plot show the median, upper and lower quartiles, and individual values. Interestingly, reduced Na+ concentrations were observed after hydration when compared to the samples before and after the race. In endurance horses, Na+ remains relatively normal because a similar volume of fluid is lost, and plasma changes are rarely seen despite sweat losses (Flaminio and Rush, 1998). There are compensatory mechanisms to maintain Na+ levels; its absorption occurs throughout the entire small intestine and colon by simple diffusion, the Na+/K+ pump in the jejunum and Na+/glucose transport occurs, which is very efficient in the presence of glucose (Sosa-Leon et al., 1995; Nyman et al., 1996). As mentioned previously, the medical treatment in the hospital, is not standardized, and fluid therapy is administered until the clinical parameters are restored. However, we must also highlight that the Na+ concentrations at discharge remained within the confidence intervals. Although within the reference range, there was a decrease in Cl- ions upon leaving the hospital. Losses of Cl- in horse sweat are important, while the Cl- concentration in sweat is almost double that in plasma, while for Na+, concentrations are similar (Carlson, 1987). Hypochloremia leads to the kidneys reabsorbing bicarbonate to maintain electrical neutrality and thus, promotes the development of metabolic alkalosis, moving to an alkaline pH (Flaminio and Rush, 1998). At the intestinal level, Cl- is absorbed by the co-transport of Na+ and K+ as well as by colonic exchange with bicarbonate. Therefore, polyionic solutions should be administered for the optimal absorption of Cl-, considering that its absorption is more limited than that of Na+ (Schott et al., 1997). Another explanation for the decrease in Cl- in the medical discharge sample is that most owners use balanced electrolyte solutions to replace the athlete’s fluids, but in contrast to Na+, hypochloremia in endurance horses is frequent thus, this should be considered (e.g., the addition of this specific anion).
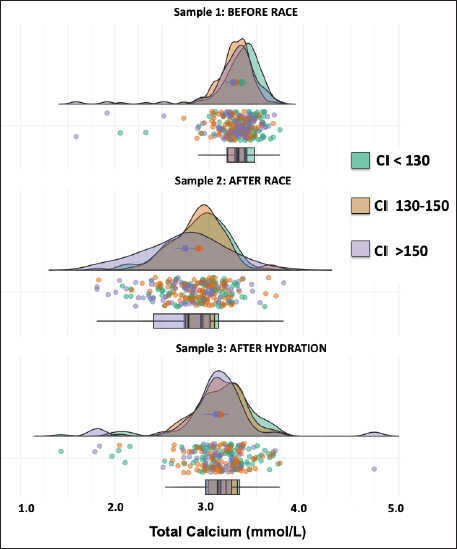
Fig. 5. Individual total calcium values (dots) and normal distribution of total calcium concentrations in sample 1 (before the race), sample 2 (after the race), and sample 3 (after rehydration). Different colors represent CI. The box and whisker plot show the median, upper and lower quartiles, and individual values. The recovery of calcium at the time of medical discharge was relevant, but it was still lower than the concentration before the race. Several authors have highlighted that this reduction is due to the use of muscle cells and loss of sweat during physical activity, especially during resistance exercises (McCutcheon and Geor, 1998). The decrease in iCa++ leads to relative hypocalcemia which affects Na+ channels and alters membrane potentials, reducing the threshold potential of the phrenic nerve and causing depolarization (Flaminio and Rush, 1998). Decreased potassium concentrations were found after the race and hydration in CI 130-150. It should be considered that the K+ concentration in the sweat is more than 13 times higher than that in the plasma (Carlson and Ocen, 1979). Potassium is present in low concentrations in the extracellular fluid but is highly concentrated in red blood cells and muscle fibers (Carlson, 1975). The concentration of electrolyte K+ intervenes in the vasodilation mechanism, which is essential to maintain muscle perfusion during exercise, its deficiency is related to muscle ischemia and rhabdomyolysis (Bernardi et al., 2018). Low K+ concentrations have been explained by the downregulation of the Na+/K+ pump in the skeletal muscle, altering membrane potential and muscle excitability (Foreman, 1998). This decrease is also attributed to a result of metabolic alkalosis, which drives potassium into the cells, and a physiological re-entry of the ion into the intracellular compartment after exercise. Dehydration increases sodium reabsorption at the expense of the excretion of potassium and hydrogen ions, which contributes to hypokalemia and metabolic alkalosis (Ecker, 1995). In conclusion, most hydroelectrolytic and acid-base variables at the medical discharge did not reach the values before the race, but they were within the normal values. The CI was a non-explanatory source of variability for most variables in this study.
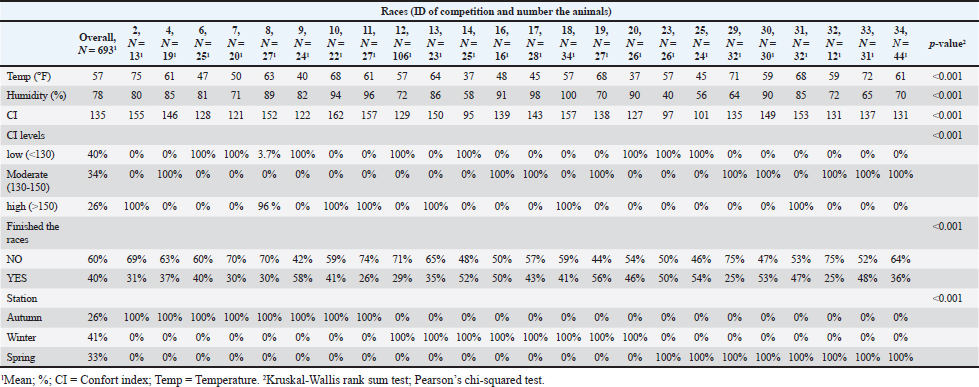
Fig. 6. Individual potassium values (dots) and normal distribution of potassium concentrations in sample 1 (before the race), sample 2 (after the race), and sample 3 (after rehydration). Different colors represent CI. The box and whisker plot show the median, upper and lower quartiles, and individually values. AcknowledgmentsThe authors would like to acknowledge the Federación Ecuestre Uruguaya (FEU), Supra, Laboratorio Ripoll (Uruguay), Pedro Martino, Elizabeth Pechiar, Carlos Soto, and the veterinarians and students who collaborated in the field study. Conflict of interestThe authors declare that there is no conflict of interest. Authors’ contributionsConceptualization, G.M.; methodology, G.M.; formal analysis, G.M. and G.S.; writing—original draft preparation, G.M.; writing—review and editing, M.M., A.M., and G.S. All authors have read and agreed to the published version of the manuscript. FundingThis research received no external funding. Data availabilityAll data are provided in the manuscript. ReferencesBennet, E. D. and Parkin, T. D. H. 2018. Fédération Equestre Internationale endurance events: risk factors for failure to qualify outcomes at the level of the horse, ride and rider (2010–2015). Vet. J. 236, 44–48. Bernardi, N. S., Gomide, L. M. W., Antunes, A. D., Gravena, K., Dias, D. P. M., Queiroz, D. J., Canello, V. A., Silva, A. M. G. B., Brandi, R. A. and Lacerda-Neto, J. C. 2018. Equilíbrio ácido-base e hidroeletrolítico em equinos submetidos à simulação de enduro FEI. Arquivo Brasileiro de Medicina Veterinaria e Zootecnia, 70(2), 359–367. Bonilla, J. 2005. Respuesta hematológica al ejercicio. Revista de Ciencias de la Salud, 3(2), 206–216. Carlson, G. P. 1975. Hematologic alterations in endurance-trained horses. In Proceedings of the First International Symposium on Equine Hematology, Lansing, MI, pp: 473. Carlson, G. P. and Ocen, P. O. 1979. Composition of equine sweat following exercise in high environmental temperatures and in response to intravenous epinephrine administration. J. Equine Med Surg. 3, 27. Carlson, G. P. 1987. Hematology and body fluids. In Gillespie JR, Robinson NE (eds): Equine exercise physiology 2. Davis, CA: ICEEP Publications, pp: 393. Corley, K. and Stephen, J. 2008. Appendix: haematology, biochemistry and electrolytes. In The Equine Hospital Manual. Corley, K. and Stephen, J. Eds., Hoboken, NJ: John Wiley and Sons, pp: 654–689. Ecker, G.L. 1995. Fluid and ion regulation: a primer on water and ion losses during exercise. Equine Vet. Educ. 7, 210. F.E.U. 2021. Reglamento Actual General de Raid de La Federación Ecuestre Uruguaya. Available via http://www.federacionecuestreuruguaya.com.uy/documentacion.html Fielding, C. L., Magdesian, K. G., Rhodes, D. M., Meier, C. A. and Higgins, J. C. 2009. Clinical and biochemical abnormalities in endurance horses eliminated from competition for medical complications and requiring emergency medical treatment: 30 cases (2005-2006). J. Vet. Emerg. Crit. Care (San Antonio), 19(5), 473–478. Fielding, C. L., Meier, C. A., Balch, O. K. and Kass, P. H. 2011. Risk factors for the elimination of endurance horses from competition. J. Am. Vet. Med. Assoc. 239(4), 493–498. Flaminio, M. J. and Rush, B. R. 1998. Fluid and electrolyte balance in endurance horses. Vet. Clin. North. Am. Equine Pract. 14(1), 147–158. Foreman, J. H. 1998. The exhausted horse syndrome. Vet. Clin. North Am. Equine Pract. 14(1), 205–219. Hodgson, D. R., McCutcheon, L. J., Byrd, S. K., Brown, W. S., Bayly, W. M., Brengelmann, G. L. and Gollnick, P. D. 1993. Dissipation of metabolic heat in the horse during exercise. J. Appl. Physiol. 74(3), 1161–1170. Jones, S. 2009. Horseback riding in the dog days. Animal Science e-News, 2, 3-4. Available via http://www.uaex.edu/farmranch/animals-forages/docs/ansc%20e-news%20july2009.pdf (Accessed 12 December 2013). Lindinger, M. I. 2008. Sweating, dehydration and electrolyte supplementation: challenges for the performance horse Proceedings of the 4th European Equine Health and Nutrition Congress, The Netherlands, April (18-19). Marichal, G., Trigo, P., Soto, C., Meikle, A. and Suárez, G. 2023. Hydroelectrolytic and acid–base parameters after 80 to 115 km endurance races (Raid Uruguayo) and Their Association with the Comfort Index. Animals, 13(4), 670. Marlin, D.J., Scott, C.M., Schroter, R.C., Mills, P.C., Harris, R.C., Harris, P.A., Orme, C.E., Roberts, C.A., Marr, C.M., Dyson, S.J. 1996. Physiological responses in nonheat acclimated horses performing treadmill exercise in cool (20 _C/40%RH), hot dry (30 _C/40%RH) and hot humid (30 _C/80%RH) conditions. Equine Vet. J. 28, 70–84. McCutcheon, L.J. and Geor, R. J. 1998. Sweating sweating: fluid and Ion losses and replacement. Vet. Clin. North Am. Equine Pract. 14(1), 75–95. Muñoz-Alonzo, L., Silva, A. B., Leal, J. C. and Luengo, M. B. 2016. Motivos de Eliminación en Competencias de Enduro Internacional, Categoría Jinete Adulto, en Chile (2007-2014). Rev. Investig. Vet. Perú. 27(2), 259–266. Nagy, A., Murray, J. K. and Dyson, S. 2010. Elimination from elite endurance rides in nine countries: a preliminary study. Equine Vet. J. Suppl. (38), 637–643. Nagy, A., Murray, J. K. and Dyson, S. J. 2013. Descriptive epidemiology and risk factors for eliminations from Fédération Equestre Internationale endurance rides due to lameness and metabolic reasons (2008–2011). Equine Vet. J. 46(1), 38–44. Nyman, S., Jansson, A., Dahlborn, K. and y Lindholm, A. 1996. Strategies for voluntary rehydration in horses during endurance exercise. Equine Vet. J. 22, 99–106. Poškienė, I., Juozaitienė, V., Gruodytė, R. and Antanaitis, R. 2020. The effect of 60 km endurance exercise on serum electrolytes and acid–base balance in the Žemaitukai horses. Acta Veterinaria Brno, 89(2), 125–131. Robert, C., Goachet, A., Fraipont, A., Votion, D., Van Erck, E., Leclerc, J. 2010. Hydration and electrolyte balance in horses during an endurance season. Equine Vet. J. 42, 98–104. Saltin, B. 1988. Capacity of blood flow delivery to exercising skeletal muscle in humans. Am. J. Cardiol. 62(8), 30E–35E. Schott, H. C., McGlade, K. S., Molander, H. A., Leroux, A. J. and Hines, M. T. 1997. Body weight, fluid, electrolyte, and hormonal changes in horses competing in 50- and 100-mile endurance rides. Am. J. Vet. Res. 58(3), 303–309. Sosa-León, L.A., Davie, A.J., Hodgson, D.R. and Rose, R.J. 1995. The effects of tonicity, glucose concentration and temperature o an oral rehydration solution on its absorption and elimination. Equine Vet. J. 20, 140–146. Younes, M., Robert, C., Cottin, F. and Barrey, E. 2015. Speed and cardiac recovery variables predict the probability of elimination in equine endurance events. PLoS One 10(8), e0137013. Supplementary Table 1. Values of temperature (C0), humidity (%), CI value and percentage (%) for levels, and the completion status (%) or stage (%) by 24 races in 90 km Federate RAID.
| ||
| How to Cite this Article |
| Pubmed Style Marichal G, Suárez G, Meikle A, Muriel M. Post competition recovery of hydroelectrolytic and acid-base variables under distinct comfort indexes in equines participating in 90 km Federate RAID. Open Vet. J.. 2024; 14(12): 3203-3212. doi:10.5455/OVJ.2024.v14.i12.5 Web Style Marichal G, Suárez G, Meikle A, Muriel M. Post competition recovery of hydroelectrolytic and acid-base variables under distinct comfort indexes in equines participating in 90 km Federate RAID. https://www.openveterinaryjournal.com/?mno=208478 [Access: June 26, 2026]. doi:10.5455/OVJ.2024.v14.i12.5 AMA (American Medical Association) Style Marichal G, Suárez G, Meikle A, Muriel M. Post competition recovery of hydroelectrolytic and acid-base variables under distinct comfort indexes in equines participating in 90 km Federate RAID. Open Vet. J.. 2024; 14(12): 3203-3212. doi:10.5455/OVJ.2024.v14.i12.5 Vancouver/ICMJE Style Marichal G, Suárez G, Meikle A, Muriel M. Post competition recovery of hydroelectrolytic and acid-base variables under distinct comfort indexes in equines participating in 90 km Federate RAID. Open Vet. J.. (2024), [cited June 26, 2026]; 14(12): 3203-3212. doi:10.5455/OVJ.2024.v14.i12.5 Harvard Style Marichal, G., Suárez, . G., Meikle, . A. & Muriel, . M. (2024) Post competition recovery of hydroelectrolytic and acid-base variables under distinct comfort indexes in equines participating in 90 km Federate RAID. Open Vet. J., 14 (12), 3203-3212. doi:10.5455/OVJ.2024.v14.i12.5 Turabian Style Marichal, Gonzalo, Gonzalo Suárez, Ana Meikle, and Marcos Muriel. 2024. Post competition recovery of hydroelectrolytic and acid-base variables under distinct comfort indexes in equines participating in 90 km Federate RAID. Open Veterinary Journal, 14 (12), 3203-3212. doi:10.5455/OVJ.2024.v14.i12.5 Chicago Style Marichal, Gonzalo, Gonzalo Suárez, Ana Meikle, and Marcos Muriel. "Post competition recovery of hydroelectrolytic and acid-base variables under distinct comfort indexes in equines participating in 90 km Federate RAID." Open Veterinary Journal 14 (2024), 3203-3212. doi:10.5455/OVJ.2024.v14.i12.5 MLA (The Modern Language Association) Style Marichal, Gonzalo, Gonzalo Suárez, Ana Meikle, and Marcos Muriel. "Post competition recovery of hydroelectrolytic and acid-base variables under distinct comfort indexes in equines participating in 90 km Federate RAID." Open Veterinary Journal 14.12 (2024), 3203-3212. Print. doi:10.5455/OVJ.2024.v14.i12.5 APA (American Psychological Association) Style Marichal, G., Suárez, . G., Meikle, . A. & Muriel, . M. (2024) Post competition recovery of hydroelectrolytic and acid-base variables under distinct comfort indexes in equines participating in 90 km Federate RAID. Open Veterinary Journal, 14 (12), 3203-3212. doi:10.5455/OVJ.2024.v14.i12.5 |

