


| Research Article | ||
Open Vet. J.. 2024; 14(12): 3219-3231 Open Veterinary Journal, (2024), Vol. 14(12): 3219-3231 Research Article Enhanced inhibitory effects of gamma-aminobutyric acid on renal and hepatic function, molecular profiles, and histological changes in male albino miceMohammed Abdullah Ajeel1* and Israa A. Al-Robaiee21Department of Clinical Laboratory Science, College of Pharmacy, University of Mosul, Mosul, Iraq 2Department of Internal and Preventive Medicine, College of Veterinary Medicine, University of Mosul, Mosul, Iraq *Corresponding Author: Mohammed Abdullah Ajeel. Department of Clinical Laboratory Science, College of Pharmacy, University of Mosul, Mosul, Iraq. Email: Mohammed91 [at] uomosul.edu.iq Submitted: 24/07/2024 Accepted: 24/11/2024 Published: 31/12/2024 © 2024 Open Veterinary Journal
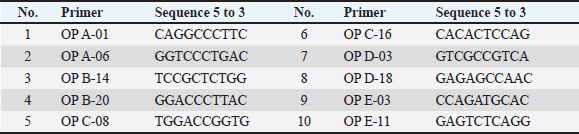
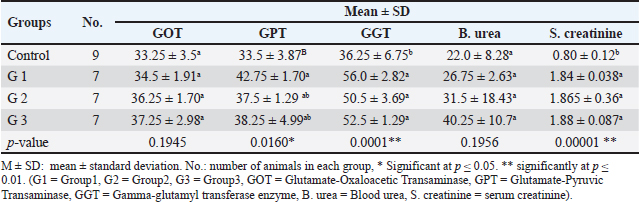
AbstractBackground: The gamma-aminobutyric acid (GABA) receptors are considered the main inhibitory neurotransmitter receptors in the mammalian brain and they have been proven to be existing in non-neuronal cells. Aim: Lorazepam which is one of the benzodiazepines, drugs known for their effect of GABA receptors, has been used in this study as an enhancer to determine the impact of GABA activity enhancement on renal and liver functions, molecular and histological characteristics in male albino mice. Methods: Male albino mice were divided into 3 groups (each has 7 animals) each group was treated with a different dose of lorazepam and 9 animals served as a control group. The molecular parameters included the usage of raped—polymerase chain reaction to detect any universal variations. The histological changes were detected using hematoxylin and eosin histopathological examination. Liver and kidney function tests were utilized to detect any functional changes. Results: The results of the functional parameters [serum urea, creatinine, glutamate-oxaloacetic transaminase, glutamate-pyruvic transaminase, gamma glutamyl enzyme (GGT)] and histopathological examination demonstrated that there was a significant change in treated groups compared to the control group. As for the molecular study, 7 primers out of 10 gave single and polymorphic bands using the random amplification of polymorphic DNA (RAPD) technique. The results revealed great changes in RAPD profiles of treated groups as normal bands lost and new bands appeared in comparison with the control group. The RAPD profiles of the treated and control samples gave 432 bands, 109 as control bands, 167 (loss of normal bands and appearance of new bands) as polymorphic bands, and 156 as homomorphic bands. Conclusion: The marked changes in various biochemical, histopathological, and random amplified polymorphic DNA–polymerase chain reaction profiles indicate that lorazepam-mediated GABA modulation brings about widespread alterations in peripheral organ systems. Taken together, these data suggest caution in the use of lorazepam clinically and potentially represent an unmet need for safer therapeutic alternatives or strategies to limit benzodiazepine-induced organ toxicity. Keywords: GABA, Molecular features, Lorazepam, Molecular impact, Functional characteristics. IntroductionGamma-aminobutyric acid (GABA) is the major inhibitory neurotransmitter in the mammalian central nervous system, where it modulates neural excitability and contributes to network homeostasis. The inhibitory action of GABA is mediated through activation of the two major classes of mammalian GABA receptors, and thereby increasing chloride (Cl-) conductance which consequently hyperpolarizes neurons leading to less likely generation of an action potential (Sigel and Steinmann, 2012). Although the function of GABA in the central nervous system has been elucidated, recent studies have shown that these effects are extended to peripheral organs such as the kidney and liver (Sigel and Buhr, 1997; Sigel and Luscher, 2011). The kidneys are a vital organ, playing a critical role in multiple aspects of physiological homeostasis. They are important for several functions such as the excretion of waste, regulation, and balance of electrolytes, and blood pressure control (Liu et al., 2005). The liver, on the other hand, is synthesizing proteins and biochemicals necessary for digestion as well as detoxification (Li et al., 2012; Wang et al., 2016). GABA has been shown to be present in renal tissue and GABA_A & B receptors are expressed in the kidneys, suggesting that it may modulate renal blood flow, glomerular filtration rate (GFR), as well as electrolyte transport (Liu et al., 2005; Luján et al., 2005). GABAergic signaling may have wider ramifications in the liver by affecting glycogen metabolism, biliary secretion, and hepatocyte mitotic activity. These results suggest that lorazepam, by increasing GABAergic activity (Erdö, 1985). The molecular basis for the effects of lorazepam on renal and hepatic function is multifaceted. GABA_A receptor activation in renal and hepatic tissues can attenuate ion channel activity, activate intracellular signaling cascades, or regulate gene expression (Skerritt and Johnston, 1983; Takano et al., 2014). These molecular events cause many cellular responses, including cell proliferation and apoptosis (Erdö, 1985; Takano et al., 2014). Further, the histological effects of lorazepam are useful to confirm the damaging changes in renal and liver tissues. As an example, intrarenal GABAergic modulation has been demonstrated to mitigate renal fibrosis and inflammation in experimental models of kidney disease (Di Lazzaro et al., 2000, 2005). Augmented GABAergic activity leads to reduced hepatocyte apoptosis and enhanced hepatic regenerative capacity following injury in the liver (Skerritt and Johnston, 1983; Sigel and Luscher, 2011). Similarly, the molecular data confirmed these observations by identifying differences in expression levels of key proteins related to inflammation and apoptosis pathways, and tissue remodeling (Sigel and Luscher, 2011). The aim of this study was to determine the impact of GABA modulation on some functional, molecular, and histological characteristics in male albino mice. Materials and MethodsAnimals and treatmentsAdult male mice (Mus musculus) were used in this study. Experiments on mice were performed at Mosul University/College of Veterinary Medicine. GABA inhibitory enhancement was carried out using lorazepam. In this study, 30 albino adult male albino mice weighing 25–30 g were used, out of which 21 were divided into 3 groups each receiving a different dose of the drug, and 9 mice were kept as control. Mice were given ad libitum access to water and food. A balanced rodent chow, containing 20% protein, 7% fat, and 5% fiber, was used to meet their nutritional needs. Environmental conditions were consistently maintained throughout the experiment, with temperature set at 24°C–26°C, humidity at 60%–70%, and a 12-hour light/dark cycle. Drug dosesLorazepam drug was administered in daily single doses of 1 (mg/kg) body weight, for one of the mice groups, 2 mg/kg body weight for the second group, and 3 mg/kg body weight for the third group. Drug doses were delivered orally for 2 months. A similar amount of normal saline was given to the control group of mice. Histopathological examinationHistological sides were prepared to evaluate the impact of GABA enhancement using lorazepam on liver and kidney tissues. After 2 weeks mice were sacrificed after giving deep ether anesthesia (3–5 ml of ether was placed on a gauze pad inside the chamber for each mouse). All blood of each mouse was collected in EDTA tubes for functional parameters assessment and DNA extraction. The liver and kidney were taken out and fixed in 10% formal saline. Paraffin blocks were prepared and sections were cut at 5 µm thickness and stained with hematoxylin and eosin after that the prepared histological slides were observed under a light microscope (Bancroft et al., 2013). Physiological parametersGABA modulation effect on functional states was observed using several physiological parameters as flow: Blood urea and serum creatinine were used as an indication of kidney functional states, while Glutamate-Oxaloacetic Transaminase (GOT), Glutamate-Pyruvic Transaminase (GPT), Gamma-glutamyl transferase enzyme (GGT) were used as a functional indication of liver states. All tests were performed using a biochemical Analyzer SK3002B according to the manufacturer’s recommendations. DNA extraction and random amplified polymorphic DNA–polymerase chain reaction (RAPD-PCR) analysisRAPD-PCR was used to detect the molecular impact of GABA modulation on the genomic DNA. RAPD-PCR technique was optimized according to (Williams et al., 1990) using ten arbitrary primers (Operon Tech., Inc) as shown in Table 1. Total genomic DNA was extracted from the liver, brain, kidney, and blood (Hermans et al., 2018). Agarose gel electrophoresis stained with RedSafe was used to assess the integrity and quality of genomic DNA, while the optimum DNA concentration for polymerase chain reaction (PCR) analysis was determined by measuring the absorbance of DNA solution at 260 to 280 nm (A260/A280). PCR master mix supplied by Cleaver company (British) was used to carry out RAPD-PCR reactions, a total volume of 20 μl including 10 μl of master mix, 100 ng of template DNA, and 10 Pico mole of primer were added in each tube, vortex and spin of the tubes before PCR amplifications that performed in a Thermal Cycler from Applied Biosystems using a thermal cycler programmed, one cycle for 4 minutes at 94° for first denaturation, followed by 40 cycles, each with 30 seconds at 94° for denaturation, 45 seconds at 36° to of annealing, 45 seconds at 72° for extension and final cycle for 7 minutes at 72° for the final extension. RAPD-PCR products were analyzed by 1.5% agarose gel electrophoresis stained with red safe in 1X TBE buffer at 90 volts for 2 hours (5 volt/cm) and visualized under U.V. gel documentation, standard 100 bp DNA ladder (BioLabs) was used as molecular marker. Statistical analysisData were organized, tabulated, and statistically analyzed using the SPSS Version 20.0. (SPSS Inc., Chicago, IL). For quantitative data, the mean and SD were calculated. For the comparison of means of more than two groups, the ANOVA test was used. p value of less than 0.05 and 0.001, respectively, were considered statistical significance. Only reproducible and clear amplification bands were scored. The marked changes observed in RAPD profiles as a disappearance and/or appearance of bands in comparison with untreated control RAPD profiles (a/b bands) were evaluated. The polymorphism values were performed according to as follows: Polymorphism value = (Total No. of polymorphic band of treated group/Total No. of control band) ×100. Genomic template stability (GTS) was calculated by the following equation: GTS (%)=(1 - a/n) ×100; since (a) is the number of polymorphic bands detected in each treated sample, and (n) is the number of total bands detected in the control. Ethical approvalAn ethical approval No: UM. VET.2021. 082 on 18/3/2021 was obtained from the Institutional Animal Care and Use Committee at the University of Mosul, College of Veterinary Medicine. ResultsPhysiological and biochemical parametersLiver enzyme levels For GOT, no significant differences were observed between the groups ( p=0.1945), indicating that GOT levels remained relatively stable across the control and experimental groups. The control group showed a mean GOT level of 33.25 ± 3.5, which was slightly higher than the other experimental groups, but this difference was not statistically significant. In contrast, GPT levels were significantly elevated in Group 1 (G1), with a mean of 42.75 ± 1.70 compared to the control group’s 33.5 ± 3.87 ( p=0.0160). Groups 2 and 3 showed moderate increases in GPT, but these differences were not statistically significant when compared to Group 1. For GGT, significant increases were seen across all experimental groups. Group 1 exhibited the highest GGT level of 56.0 ± 2.82, significantly higher than the control group’s 36.25 ± 6.75 (p < 0.01). Groups 2 and 3 also showed elevated GGT levels (50.5 ± 3.69 and 52.5 ± 1.29, respectively), with statistically significant differences from the control group (p < 0.01). Kidney function markers Regarding blood urea levels, no significant differences were found between the groups ( p=0.1956), with the control group showing a mean blood urea level of 22.0 ± 8.28. The experimental groups had slightly higher levels, with Group 1 at 26.75 ± 2.63, Group 2 at 31.5 ± 18.43, and Group 3 at 40.25 ± 10.7, but these differences were not statistically significant. However, serum creatinine levels showed a highly significant increase across all experimental groups (p < 0.01). The control group had a mean serum creatinine of 0.80 ± 0.12, while Group 1 had a significantly higher value of 1.84 ± 0.038. Groups 2 and 3 also exhibited elevated serum creatinine levels (1.865 ± 0.36 and 1.88 ± 0.087, respectively), with both significantly different from the control group (p < 0.01). Histopathological examination Mouse liver from the control group shows a normal radiant arrangement of the hepatic cells (Fig. 1). Pathological changes in treated liver sections showed an increase in the immune cells’ infiltration, and marked congestion were observed in almost all mice. In group 1, there was hemorrhage, congestion, and degenerated cells (Fig. 2). In group 2, there was congestion of the central vein, infiltration of immune cells, and degeneration of hepatocytes (Fig. 3). Whereas in group 3, the previously mentioned changes were markedly intensified with severe hemorrhage and marked sinusoidal dilatation (Fig. 4). Mouse kidney of control group shows normal cellular appearance (Fig. 5); however, pathological changes in treated kidneys sections reveals congestion, tubular necrosis and cast in some tubule’s lumen, group 1 (Fig. 6). In group 2, there was congestion, tubular necrosis, necrotic debrites in the tubuli lumen and cast (Fig. 7). Whereas in group 3 there was marked congestion, tubular and cellular necrosis, necrotic debrites in the tubular lumen and degenerated cells (Fig. 8). Molecular analysis A RAPD-PCR technique was carried out to detect the changes on the extracted DNA of liver, kidney, brain, and blood of all the groups. In total, 10 oligonucleotide primers were used to screen genomic DNA from the treated and untreated organisms. Three (OP D-18, OP E-03, and OP E-11) of the 10 primers were unable to amplify the genomic DNA. The other seven primers (OP A-01, OP A-06, OP B-14, OP B-20, OP C-08, OP C-16, and OP D-03 were able to produce 432 visible bands. ALL primers produced homomorphic and polymorphic bands of the treated and control animals, different sizes of band obtained in the RAPD profile was from 100 to 1,500 bp, the number of bands ranged between 1 and 8 with an average of five bands as shown in Figure 9. Table 1. Primers and their sequences used with RAPD-PCR.
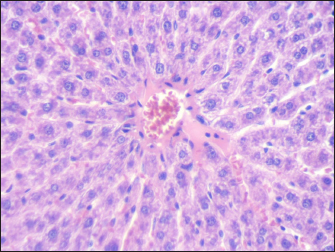
Fig. 1. Section of mouse liver from control group showing normal radiant arrangement of the hepatic cells (H and E, 400×).
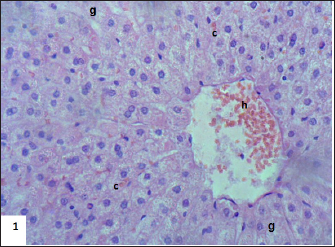
Fig. 2. Section of mouse liver fed with 1 mg/kg Lorazepam showing hemorrhage (h) and congestion (c) the cells are highly degenerated with pyknotic cells and cell ghost (g) (H and E, 400×). Effect of GABA enhancement effect by lorazepam on RAPD-PCR patternThe existence of changes in the RAPD profiles obtained from the mice genomic treated and control depended on the primer used. The seven primers produced DNA profiles that showed variations between control and treated cells, with visible changes in the number and size of DNA fragments amplified. The absence of a normal band and/or the appearance of a new band are the obvious changes caused by lorazepam treatments in the RAPD patterns. Table 3 and Figure 7 show a complete description of the RAPD-PCR profiles of the seven primers for all lorazepam treatments including several polymorphic bands and the polymorphic percent of each treated.
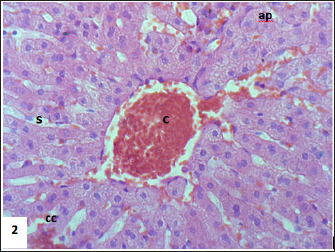
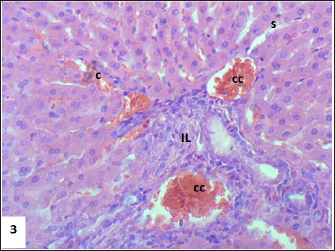
Fig. 3. Section of mouse liver fed with 2 mg/kg Lorazepam showing congestion of central vein (C), and sinusoidal dilatation (s), ballooning degeneration of some of hepatocytes, pyknotic cells, marked steatosis and congestion (cc) with some apoptotic cells (ap) (H and E, ×400).
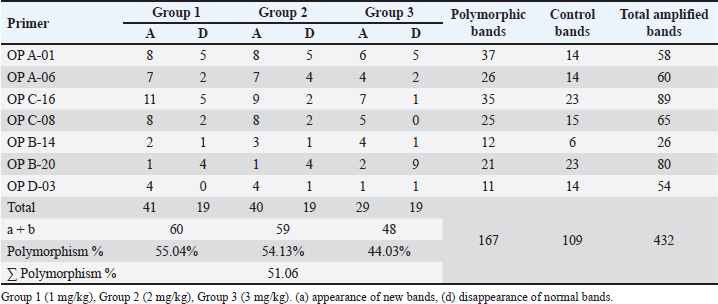
Fig. 4. Section of mouse liver fed with 1 mg/kg Lorazepam showing marked steatosis and congestion (cc) and sinusoidal dilatation (s), (b) showing infiltration (IN), degenerated cells, and congestion in sinusoids (c) (H and E, ×400). The results shown in Table 3 indicate that there are differences in the total number of bands and the number of lost and gained bands for all treatments, in addition to the difference in the polymorphic percentage between treatments of the same sample and between all samples. All of all, the used seven primers have produced a total of 432 bands for the RAPD profiles of the treated and control samples, 109 of them as a control band, 167 (loss of normal bands and appearance of new bands) as polymorphic bands, and others 156 as a homomorphic band. The samples treated with 1 and 2 mg/kg of Lorazepam displayed the highest variation in the number of polymorphic bands in RAPD analysis (60 and 59), respectively, the appearing of a new band was 41 and 40, respectively, while the disappearing of normal bands was 19 for both treatments. The polymorphisms in RAPD profiles might be due to the gain (new appearance) and/or loss (disappearance) of the amplified bands as compared to the control RAPD profile. The high value of genetic polymorphic percent (55.04%) was for 1 mg/kg treatment compared with the 3 mg/kg treatment which gave the lowest polymorphic percent (44.03%). The Lorazepam concentration (1 mg/kg) gave the highest rate of genetic polymorphism (55.04%). In contrast, this degree of genetic polymorphism was reduced to (44.03%) of the (3 mg/kg) treated. The OP A-01 gave the highest number of polymorphic bands (37), while the lowest number was for OP D-03 primer (11) bands.
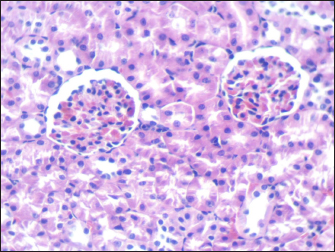
Fig. 5. Section of mouse kidney of control group shows normal cellular appearance (H and E, ×400).
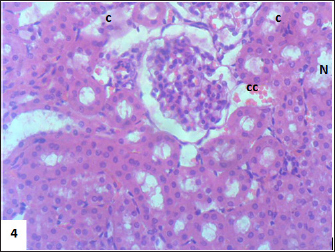
Fig. 6. Section of mouse kidney fed with 1 mg/kg Lorazepam showing congestion (cc), tubular necrosis (N), and cast (c), (H and E, ×400).
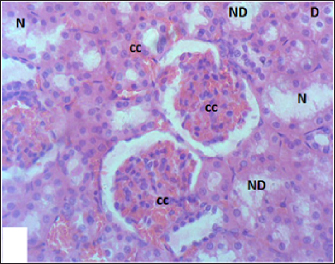
Fig. 7. Section of mouse kidney fed with 2 mg/kg Lorazepam showing congestion (cc), tubular necrosis (N), necrotic debrites in the tubuli lumen (ND) and cast (c), (H and E, ×400).
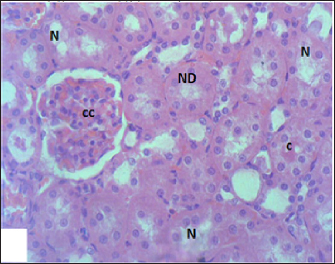
Fig. 8. Section of mouse kidney fed with 3 mg/kg Lorazepam showing marked congestion (cc), tubular and cellular necrosis (N), necrotic debrites in the tubuli lumen (ND) and degenerated cells (D), (H and E, ×400).
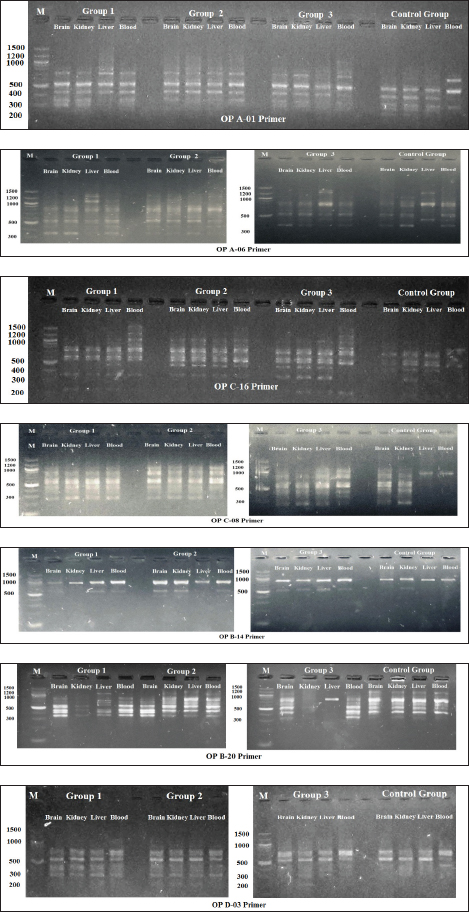
Fig. 9. Shows 1.5% agarose gel electrophoresis of RAPD-PCR profiles of genomic DNA (brain, kidney, liver, and blood) of male albino mice (M. musculus) treated with different Lorazepam concentrations using OP A-01, OP A-06, OP C-16, OP C-08, OP B-14, OP B-20 and OP D-03 primers. Table 2. Physiological parameters of liver and kidney.
Table 3. Number of control, polymorphic bands (appearance or absence) and polymorphism percent generated by RAPD-PCR profiles of genomic DNA of brain of male albino mice (M. musculus) treated with different Lorazepam concentrations.
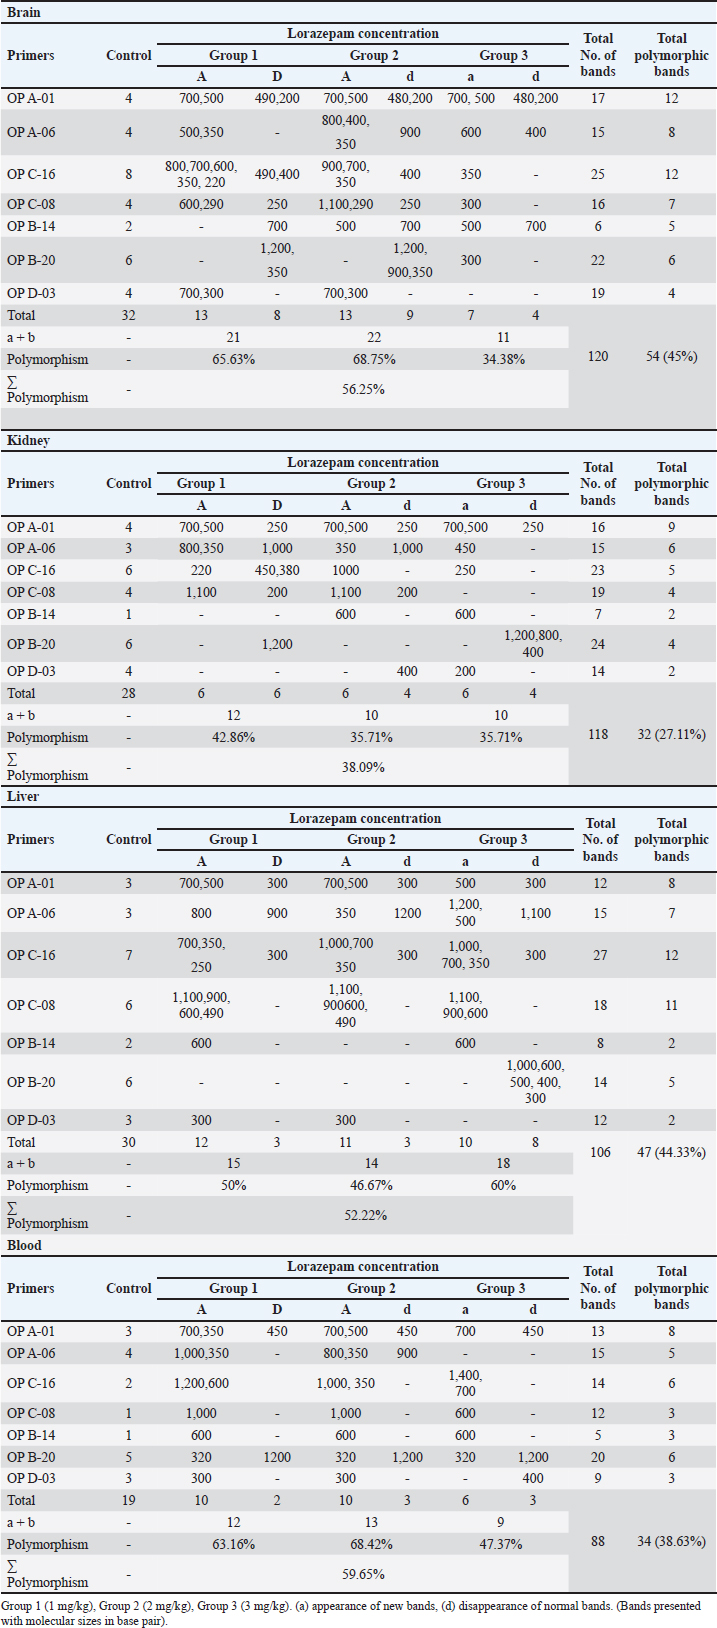
Table 4. The total number of amplified, polymorphic, control and aberrance or absence bands and polymorphism percentage of (brain, kidney, liver, and blood) samples of male albino mice treated with different Lorazepam concentrations.
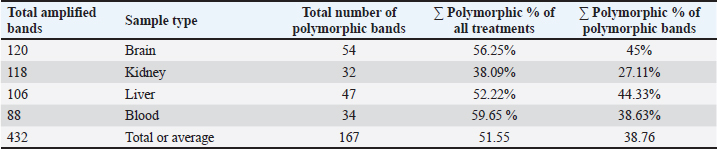
Table 5. The total number of bands and polymorphic bands, polymorphic percent of all treatments of and of polymorphic bands of RAPD-PCR profiles of (brain, kidney, liver and blood) samples of male albino mice (M. musculus) treated with different Lorazepam concentrations.
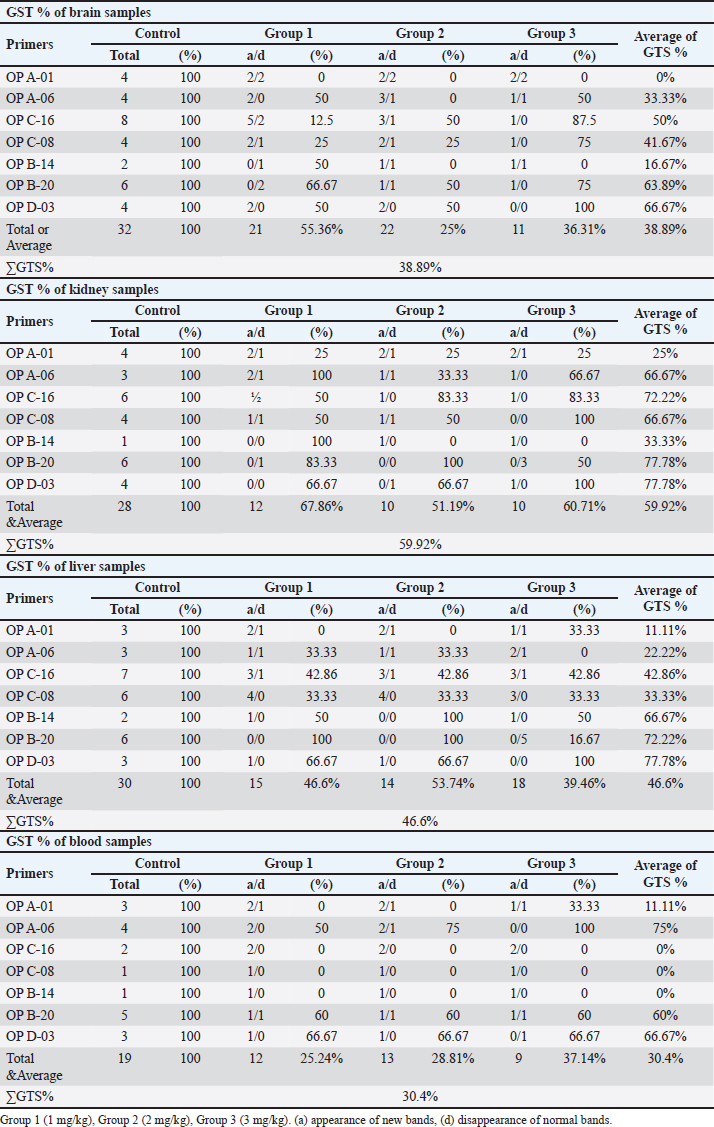
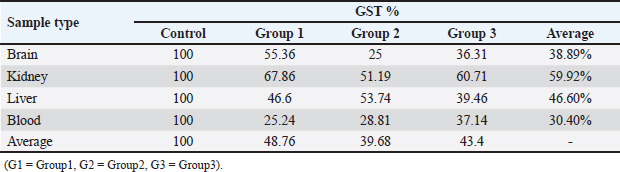
The results in Table 5 show a summary of changes in RAPD-PCR profiles of brain, kidney, liver, and blood samples treated with Lorazepam, the highest number of amplified bands was for the brain sample comparison with the lowest number of the blood sample. The highest number of polymorphic bands was for the blood sample, while the lowest number of the kidney sample. The highest polymorphic percentage was given by the blood sample, while the lowest percentage was for the kidney samples. From the above, it can be said that Lorazepam has significantly affected the blood sample as opposed to less affecting the kidney sample. Genomic template stabilityThe polymorphic patterns obtained by RAPD-PCR of the brain, liver, kidney, and blood samples for the treated group in comparison with the control group were used to measure the percentage of (GTS%). GTS% as a qualitative indicator was calculated for each primer and treatment and shown in Table 6 and Figure 8. It is shown that values decreased gradually obviously according to Lorazepam concentration. After exposure to different Lorazepam concentrations, GTS values were changed to lower values for all treated groups in comparison to the control group, which indicated that GTS was significantly affected by Lorazepam and the amount of Lorazepam reaching the treated samples and have been sufficient to produce an increase in the variations of genomic DNA. The lowest values of GST% were obtained in the brain sample (25%) that treated with a concentration (2 mg/kg) and the blood sample (25.24%) treated with a concentration (1 mg/kg). This may be due to the lead toxicity at higher concentrations which caused heavy DNA damage in the treated samples, while in the Kidney samples, higher GTS values were obtained (67.86%) treated with concentration (1 mg/kg) and (60.71) treated with concentration (2 mg/kg), which might have less sensitivity for Lorazepam as shown in Table 9 and Figure 10. The average (GTS%) of all samples and treatments were shown in Table 7. There was a reduction in the percentage of GTS concerning untreated cells. Especially for the blood and brain which were highly sensitive and GTS values decreased to 30.40% and 38.89%, respectively, for all treatments in comparison with kidney and liver were less sensitive, with GTS values of 59.92% and 46.6%, respectively. Depending on the concentration of the treatment used, the second concentration gave the least value of GTS (39.68%) compared to the first concentration, which gave the highest value of GTS (48.76%). DiscussionThe administration of Lorazepam significantly increased serum creatinine and liver enzymes (GPT, GGT) in treated groups manifesting renal and hepatic stress. High serum creatinine levels are indicative of renal damage and the result is decreased GFR along with a risk of nephrotoxicity. This was observed similarly by Lameire et al. (2006) who demonstrated in clinical settings that the rise of creatinine is accompanied by renal injury. The elevation of aminotransferases (GOT and GPT) representing hepatocellular injury, as well as GPT and GGT consistent with cholestasis is in agreement with data derived from different studies on DILI. Table 6. GTS% of brain, kidney, liver and blood samples of the male albino mice (M. musculus) exposed to different Lorazepam concentrations.
Table 7. Average of GTS% of brain, kidney, liver and blood samples of the male albino mice (M. musculus) exposed to different Lorazepam concentrations.
However, the levels of serum BUN and GOT were not significantly changed, indicating a modest influence on renal or hepatic functions. The patterns for BUN are very similar to that of protein intake and renal function, so this could explain why there was no significant effect here as well. Likewise, GOT a less liver-specific mark is not as sensitive to hepatic damage as GPT or GGT. This is in line with the results of prior work by Corsini and Bortolini (2013). The absence of a dose-dependent response observed in groups 2 and 3 in the study can be attributed to several potential pharmacological and physiological factors. First, saturation of receptor binding sites or enzyme activity may occur at this dose, leading to a plateau effect where increasing the dose no longer produces a proportionate increase in biological response. Lorazepam acts on the GABA-A receptor, and once these receptors are saturated, further increases in dose do not elicit stronger effects on neurotransmission (Tallarida and Jacob, 1979). Additionally, a ceiling effect might explain why the 2 mg dose does not show increased toxicity or functional impairment, as the body’s systems could reach a maximal threshold of responsiveness beyond which no further effect is observed (Tallarida and Jacob, 1979; Aronson, 2007). Biological variability between animals could also play a role, as individual differences in drug metabolism, receptor sensitivity, or genetic factors could mask a clear dose-response relationship, especially in studies with small sample sizes (Ingelman-Sundberg, 2004). Furthermore, compensatory mechanisms in the liver and kidneys might mitigate the observed effects of lorazepam at this dose, as the body’s ability to repair or adapt to mild drug-induced stress could attenuate any dose-dependent changes (Goss, 1965). Finally, toxicity or damage may reach a plateau at this dose, where higher doses do not result in further physiological impairment, potentially due to a maximal toxic threshold being reached (Tallarida and Jacob, 1979; Aronson, 2007). These factors collectively contribute to the observed absence of dose dependence at the 2 mg dose of lorazepam in the study.
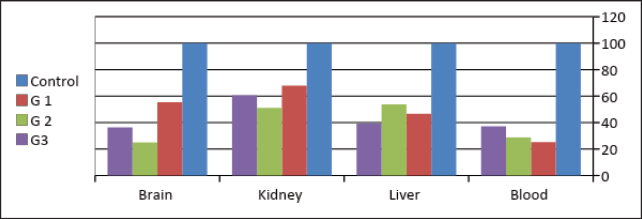
Fig. 10. Changes of GTS% of brain, kidney, liver, and blood samples of the male albino mice (M. musculus) exposed to different Lorazepam concentrations (G1=Group1, G2=Group2, G3=Group3). Morphological changes in liver and kidney tissuesHistopathologically, the livers and kidneys from the BDL group exhibited significant morpho-structural alterations Figures 1–8. Lorazepam-treated mice showed severe congestion, hemorrhage, and hepatocellular degeneration in liver sections with greater severity such as in a dose-limited manner. Such histological changes resemble those reported by Chatila (2000) who also described similar findings in drug-induced liver diseases. Infiltration of immune cells and sinusoidal dilatation are observed, indicating an inflammatory response which is consistent with this idea as independent findings by Dong et al. (2020) correlated these with severe liver injury. Pronounced congestion, tubular necrosis, and intraluminal casts were found in the kidneys. It has been reported that tubular necrosis and obstruction play a critical role in the pathophysiology of AKI (Basile et al., 2012; Kanagasundaram, 2015), which is consistent with markers for acute kidney injury. Histopathology score is dose dependent confirming the relation of the higher dose to more extent of organ damage suggesting toxicity in the form of toxic dose reaction, has been detected in lorazepam. Molecular analysisThe RAPD-PCR analysis showed prominent alterations in the DNA profiles of diverse tissues, reflecting genotoxic (genomic instability) induced by lorazepam. The appearance and disappearance of bands in the RAPD profiles demonstrates DNA damage, as well as possible mutations similar patterns were observed by Atienzar and Jha (2006) using a chemically induced genotoxicity study. Several levels of polymorphism percentages were observed in the different tissues, and a greater number of changes was recorded especially for blood and liver tissue, reflecting possible differences among organs on their susceptibility to oxidative stress or DNA damage. Lorazepam (anxiolytic sedative benzodiazepine), for example, is known to cause oxidative stress that in turn creates reactive oxygen species, and eventually, DNA damage as reported by Aruoma et al. (2006). This study’s results show that lorazepam-related effects are mediated not only by its primary pharmacological targets, but also reflected in genetic polymorphisms with implications on genomic stability and integrity. By enhancing the effect of GABA on its receptors Lorazepam influences not only CNS activity but also affects systems effects directed through neuroimmune and neuroendocrine pathways. This fits with the narrative provided by Möhler (2012), who reviewed wider systemic consequences of changing GABAergic tone. ConclusionThe marked changes in various biochemical, histopathological, and RAPD-PCR profiles indicate that lorazepam-mediated GABA modulation brings about widespread alterations in peripheral organ systems. Taken together, these data suggest caution in the use of lorazepam clinically and potentially represent an unmet need for safer therapeutic alternatives or strategies to limit benzodiazepine-induced organ toxicity. AcknowledgmentMost appreciation to the University of Mosul for providing care for animals in the animal house at the College of Veterinary Science/ and most sincere thanks for the College of Pharmacy for providing the instruments needed in the experiments at the laboratory. Conflict of interestsThe authors declare that there is no conflict of interest FundingThis research received no specific grant and has self-funding support. Authors’ contributionsIsraa A. Al-Robaiee was corresponding for animal care and clinical parameters. Mohammed A. Ajeel was corresponding for the thermal treatment and obtaining the blood samples. Article writing was done equally by both authors. Data availabilityAll data are provided in the manuscript. ReferencesAronson, J.K. 2007. Concentration-effect and dose-response relations in clinical pharmacology. Br. J. Clin. Pharmacol. 63(3), 255–257. Aruoma, O.I., Grootveld, M. and Bahorun, T. 2006. Free radicals in biology and medicine: from inflammation to biotechnology. BioFactors 27(1–4), 1–3. Atienzar, F.A. and Jha, A.N. 2006. The random amplified polymorphic DNA (RAPD) assay and related techniques applied to genotoxicity and carcinogenesis studies: a critical review. Mutat. Res. 613(2–3), 76–102. Bancroft, J.D., Layton, C. and Suvarna, S.K. 2013. Bancroft’s theory and practice of histological techniques, expert consult: online and print, 7: Bancroft’s theory and practice of histological techniques. London, UK: Churchill Livingstone. Basile, D.P., Anderson, M.D. and Sutton, T.A. 2012. Pathophysiology of acute kidney injury. Com. Physiol. 2(2), 1303–1353. Chatila, R. 2000. Hepatotoxicity: the adverse effects of drugs and other chemicals on the liver. J. Clin. Gastroenterol. 118(5), 984–985. Corsini, A. and Bortolini, M. 2013. Drug-induced liver injury: the role of drug metabolism and transport. J. Clin. Pharmacol. 53(5), 463–474. Di Lazzaro, V., Oliviero, A., Meglio, M., Cioni, B., Tamburrini, G., Tonali, P. and Rothwell, J.C. 2000. Direct demonstration of the effect of lorazepam on the excitability of the human motor cortex. Clin. Neurophysiol. 111(5), 794–799. Di Lazzaro, V., Oliviero, A., Saturno, E., Dileone, M., Pilato, F., Nardone, R., Ranieri, F., Musumeci, G., Fiorilla, T. and Tonali, P. 2005. Effects of lorazepam on short latency afferent inhibition and short latency intracortical inhibition in humans. J. Physiol. 564(Pt 2), 661–668. Dong, V., Nanchal, R. and Karvellas, C.J. 2020. Pathophysiology of acute liver failure. Nutr. Clin. Pract. 35(1), 24–29. Erdö, S.L. 1985. Peripheral GABAergic mechanisms. Trends Pharmacol. Sci. 6, 205–208. Goss, R.J., 1965. Kineticks of compensatory growth. Q. Rev. Biol. 40, 123–146. Hermans, S.M., Buckley, H.L. and Lear, G. 2018. Optimal extraction methods for the simultaneous analysis of DNA from diverse organisms and sample types. Mol. Ecol. Resour. 18(3), 557–569. Ingelman-Sundberg, M. 2004. Pharmacogenetics of cytochrome P450 and its applications in drug therapy: the past, present and future. Trends Pharmacol. Sci. 25(4), 193–200. Kanagasundaram, N.S. 2015. Pathophysiology of ischaemic acute kidney injury. Ann. Clin. Biochem. 52(Pt 2), 193–205. Lameire, N., Van Biesen, W. and Vanholder, R. 2006. The changing epidemiology of acute renal failure. Nat. Clin. Pract. Nephrol. 2(7), 364–377. Li, Y., Xiang, Y.Y., Lu, W.Y., Liu, C. and Li, J. 2012. A novel role of intestine epithelial GABAergic signaling in regulating intestinal fluid secretion. Am. J. Physiol. Gastrointest. Liver Physiol. 303(4), 453–460. Liu, X., Wang, Q., Haydar, T.F. and Bordey, A. 2005. Nonsynaptic GABA signaling in postnatal subventricular zone controls proliferation of GFAP-expressing progenitors. Nat. Neurosci. 8(9), 1179–1187. Luján, R., Shigemoto, R. and López-Bendito, G. 2005. Glutamate and GABA receptor signalling in the developing brain. Neuroscience 130(3), 567–580. Möhler, H. 2012. The GABA system in anxiety and depression and its therapeutic potential. Neuropharma 62(1), 42–53. Sigel, E. and Buhr, A. 1997. The benzodiazepine binding site of GABAA receptors. Trends Pharmacol. Sci. 39(7), 659–671. Sigel, E. and Luscher, B.P. 2011. A closer look at the high affinity benzodiazepine binding site on GABAA receptors. Curr. Top. Med. Chem. 11(2), 241–246. Sigel, E. and Steinmann, M.E. 2012. Structure, function, and modulation of GABAA receptors. J. Biol. Chem. 287(48), 40224–40231. Skerritt, J.H. and Johnston, G.A.R. 1983. Enhancement of GABA binding by benzodiazepines and related anxiolytics. Eur. J. Pharmacol. 89(3–4), 193–198. Takano, K., Yatabe, M.S., Abe, A., Suzuki, Y., Sanada, H., Watanabe, T., Kimura, J. and Yatabe, J. 2014. Characteristic expressions of GABA receptors and GABA producing/transporting molecules in rat kidney. PLoS One 9(9), e105835. Tallarida, R.J. and Jacob, L.S. 1979. The dose—response relation. The dose—response relation in pharmacology. Berlin, Germany: Springer; doi: 10.1007/978-1-4684-6265-4_1 Wang, S., Xiang, Y.Y., Zhu, J., Yi, F., Li, J., Liu, C. and Lu, W.Y. 2016. Protective roles of hepatic GABA signaling in acute liver injury of rats. Am. J. Physiol. Gastrointest. Liver Physiol. 312(3), 208–218. Williams, J.G.K., Kubelik, A.R., Livak, K.J., Rafalski, J.A. and Tingey, S.V. 1990. DNA polymorphisms amplified by arbitrary primers are useful as genetic markers. Nucleic Acids Res. 18(22), 6531–6535. | ||
| How to Cite this Article |
| Pubmed Style Ajeel MA, Al-robaiee IA. Enhanced inhibitory effects of GABA on renal and hepatic function, molecular profiles, and histological changes in male albino mice. Open Vet. J.. 2024; 14(12): 3219-3231. doi:10.5455/OVJ.2024.v14.i12.7 Web Style Ajeel MA, Al-robaiee IA. Enhanced inhibitory effects of GABA on renal and hepatic function, molecular profiles, and histological changes in male albino mice. https://www.openveterinaryjournal.com/?mno=210505 [Access: June 26, 2026]. doi:10.5455/OVJ.2024.v14.i12.7 AMA (American Medical Association) Style Ajeel MA, Al-robaiee IA. Enhanced inhibitory effects of GABA on renal and hepatic function, molecular profiles, and histological changes in male albino mice. Open Vet. J.. 2024; 14(12): 3219-3231. doi:10.5455/OVJ.2024.v14.i12.7 Vancouver/ICMJE Style Ajeel MA, Al-robaiee IA. Enhanced inhibitory effects of GABA on renal and hepatic function, molecular profiles, and histological changes in male albino mice. Open Vet. J.. (2024), [cited June 26, 2026]; 14(12): 3219-3231. doi:10.5455/OVJ.2024.v14.i12.7 Harvard Style Ajeel, M. A. & Al-robaiee, . I. A. (2024) Enhanced inhibitory effects of GABA on renal and hepatic function, molecular profiles, and histological changes in male albino mice. Open Vet. J., 14 (12), 3219-3231. doi:10.5455/OVJ.2024.v14.i12.7 Turabian Style Ajeel, Mohammed Abdullah, and Israa A. Al-robaiee. 2024. Enhanced inhibitory effects of GABA on renal and hepatic function, molecular profiles, and histological changes in male albino mice. Open Veterinary Journal, 14 (12), 3219-3231. doi:10.5455/OVJ.2024.v14.i12.7 Chicago Style Ajeel, Mohammed Abdullah, and Israa A. Al-robaiee. "Enhanced inhibitory effects of GABA on renal and hepatic function, molecular profiles, and histological changes in male albino mice." Open Veterinary Journal 14 (2024), 3219-3231. doi:10.5455/OVJ.2024.v14.i12.7 MLA (The Modern Language Association) Style Ajeel, Mohammed Abdullah, and Israa A. Al-robaiee. "Enhanced inhibitory effects of GABA on renal and hepatic function, molecular profiles, and histological changes in male albino mice." Open Veterinary Journal 14.12 (2024), 3219-3231. Print. doi:10.5455/OVJ.2024.v14.i12.7 APA (American Psychological Association) Style Ajeel, M. A. & Al-robaiee, . I. A. (2024) Enhanced inhibitory effects of GABA on renal and hepatic function, molecular profiles, and histological changes in male albino mice. Open Veterinary Journal, 14 (12), 3219-3231. doi:10.5455/OVJ.2024.v14.i12.7 |

