


| Original Article | ||
Open Vet J. 2020; 10(1): 68-73 doi: 10.4314/ovj.v10i1.11 Open Veterinary Journal, (2020), Vol. 10(1): 68–73 Original Research DOI: http://dx.doi.org/10.4314/ovj.v10i1.11 Combining non-contrast enhanced magnetic resonance thoracic ductography with vascular contrast-enhanced computed tomography to identify the canine thoracic ductKenji Kutara*, Teppei Kanda, Noritaka Maeta, Yohei Mochizuki, Fumiko Ono, Yoshiki Itoh and Taketoshi AsanumaFaculty of Veterinary Medicine, Okayama University of Science, Imabari, Japan *Corresponding Author: Kenji Kutara. Okayama University of Science, 1-3 Ikoinooka, Imabari, Ehime, Japan. Email: k-kutara [at] vet.ous.ac.jp Submitted: 18/10/2019 Accepted: 12/02/2020 Published: 15/03/2020 © 2020 Open Veterinary Journal
AbstractBackground: In humans, visualization of the thoracic duct by magnetic resonance imaging (MRI) has been attempted, and recent advances have enabled clinicians to visualize the thoracic duct configuration in a less invasive manner. Moreover, MRI does not require contrast media, and it enables visualization of morphological details of the thoracic structures. In veterinary practice, the thoracic duct has not been visualized three dimensionally in MRI. Aim: This study aimed to assess the performance of our magnetic resonance thoracic ductography (MRTD) technique to visualize the thoracic duct and the surrounding 3D anatomical structures by combining MRTD and vascular contrast-enhanced thoracic computed tomography (CT) images in dogs. Methods: Five adult male beagle dogs (11.4–12.8 kg) were included in this study. Sagittal and transverse T2-weighted images were scanned in MRI. Scanning in MRTD used a single-shot fast spin echo sequence with a respiratory gate. CT was performed after the intravenous injection of contrast medium. All MRTD and CT images were merged using a workstation. Results: The thoracic ducts were identified in MRTD images of all dogs, and the surrounding anatomical structures were located with the aid of contrast-enhanced thoracic CT. In all dogs, the thoracic ducts coursed along the right-dorsal side of the aorta, cranially from the L2 level. Thereafter, these bent to the left side at the aortic arch and curved at the left external jugular vein angle. A comparison of the number of thoracic ducts at each vertebra between transverse T2WI and MRTD did not reveal any significant differences for all vertebrae. Conclusion: The results from our study suggest that MRTD using the single-shot fast spin echo sequence could be a useful tool for visualization of the thoracic duct. Furthermore, the image merged from MRTD and vascular-enhanced images provided detailed anatomical annotation of the thorax. The MRTD protocol described in this study is safe and easily adaptable, without the need for contrast medium injection into the lymph system. In addition, the images fused from MRTD and vascular contrast-enhanced CT image of the thorax could provide detailed anatomical annotations for preoperative planning. Keywords: Computed tomography, Dog, Magnetic resonance imaging, Thoracic duct, Thoracic ductography. IntroductionThe thoracic duct is one of the main channels for the flow of lymph into the blood in the body (Bezuidenbout, 2013). It contributes to the transport of excess liquid and protein from the interstitial tissue and lipid and lipid-soluble vitamins from the gastrointestinal tract to the circulatory system (Takahashi et al., 2003). The thoracic duct in dogs is formed either as a single duct or multiple tributaries within the thoracic cavity after passing through the aortic hiatus, constituting a complex network (Kagan and Breznock, 1979). Thoracic duct ligation is the recommended surgical treatment for chylothorax (Birchard and McLoughlin, 1998; Fossum et al., 2004), and one of the major causes of ligation failures is the occurrence of mistakes in the surgery procedure. Therefore, it is important to establish reliable methods for the imaging of thoracic and abdominal lymphatic ducts in order to establish the location of the tributaries into which the thoracic duct divides (Ando et al., 2011), thus ensuring that these can be ligated. In veterinary practice, conventional radiographic lymphography and computed tomography (CT) lymphography are used to image the thoracic duct (Birchard et al., 1982; Johnson et al., 2009; Ando et al., 2011; Millward et al., 2011; Lee et al., 2012; Iwanaga et al., 2016). Three-dimensional (3D) reconstruction of CT images is useful for understanding the morphology of the thoracic duct (Ando et al., 2011). However, these imaging methods require injection of contrast media into the lymph nodes (Birchard et al., 1982; Johnson et al., 2009; Millward et al., 2011; Lee et al., 2012) and the perianal tissue followed by massage of the injection site (Ando et al., 2011; Iwanaga et al., 2016). In addition, contrast medium injection into the lymph nodes may fail, causing leakages of the contrast medium from the lymph nodes. In humans, visualization of the thoracic duct by magnetic resonance imaging (MRI) has been attempted, and recent advances have enabled clinicians to visualize the thoracic duct configuration in a less invasive manner (Takahashi et al., 2003; Kato et al., 2011). Magnetic resonance thoracic ductography (MRTD) involves the application of a three-dimensional single-shot fast spin echo (3D SS-FSE) sequence (Okuda et al., 2009). The 3D SS-FSE sequence is used to visualize only high T2 signal fluid three dimensionally. Moreover, MRI does not require contrast media and it enables visualization of morphological details of the thoracic structures. In dogs, the thoracic duct was visualized in a previous study as a hyperintense structure in a T2-weighted image (T2WI) obtained using MRI (Johnson and Seiler, 2006). However, in that study, the thoracic duct was observed only on transverse T2WI and was not visualized three-dimensionally. In the present study, we assessed the performance of our MRI technique for MRTD visualization and evaluated the visibility of the thoracic duct by fusing images acquired from MRTD and vascular contrast-enhanced thoracic CT. Materials and MethodsFive adult male beagle dogs (11.4–12.8 kg) were included in this study. This study strictly adhered to the Rules for Animal Care and Use of the Laboratory Animal Center, Imabari Campus, Okayama University of Science, compliant with the Guide for the Care and Use of Laboratory Animals. The beagles were determined to be healthy based on general physical examination, complete blood cell counts, and general serum biochemical profiles. The dogs were anesthetized by intravenous administration of propofol (4–7 mg/kg). The dogs were then intubated, and general anesthesia was maintained with inhalation of sevoflurane (2%–2.5%) and oxygen (2 l/minute) under mechanical ventilation. All dogs were positioned in ventral recumbency, and MRI was performed with a 1.5 T superconducting unit (Vantage Elan, Canon Medical Systems, Otawara, Japan). First, sagittal T2WI (TR=2,500 mseconds, TE=80 mseconds, FOV=300 × 200 mm, thickness=2.5 mm, spatial resolution=0.5 × 0.5 mm) of the thoracic spine was obtained to locate the scanning area of MRTD; additionally, transverse T2WI (TR=3,850 mseconds, TE=121 mseconds, FOV=80 × 80 mm, thickness=2 mm, spatial resolution=0.5 × 0.5 mm) of the central region of each vertebra was obtained. 3D SS-FSE as MRTD (TR=6,665 mseconds, TE=510 mseconds, FOV=320 × 320 mm, thickness=1 mm, spatial resolution=1 × 1 mm) was performed with respiratory gating. The slice number was 160. The scanning area of MRTD was determined from the fifth cervical spine (C5) to the second lumbar spine (L2) range. The scanning area consisted of the coronal plane. Total MRI scanning time was approximately 20 minutes. After the MRI scan, contrast CT was performed with a 16 MDCT scanner (Aquilion Lightning, Canon Medical Systems, Otawara, Japan). The scanning parameters were as follows: rotation time, 0.75 seconds; slice thickness, 1 mm; reconstruction interval, 0.5 mm; table speed, 16 mm/rotation; X-ray tube potential, 120 kV; and X-ray tube current, 100 mA. All helical scans started at the level of the atlas spine and covered the entire thorax. Iohexol (Omnipaque 300; Daiichi-sankyo Inc., Tokyo, Japan) was used as a contrast medium and was administered at a dose of 2 ml/kg (600 mg/kg) via injection into the cephalic vein with a power injector. The injection time was 15 seconds. A CT scan was performed 1 minutes after the start of the injection.
Fig. 1. Maximum intensity projection imaging of magnetic resonance thoracic ductography (MRTD). Cerebrospinal fluid, pleura, and kidney (renal pelvis) are shown (A, C). Unnecessary fluids were removed to construct the 3D image of MRTD (B, D). (A) Unprocessed MRTD image of the dorsal plane. (B) Processed MRTD image of the dorsal plane. (C) unprocessed MRTD image of the sagittal plane. (D) Processed MRTD image of the sagittal plane. The raw MRI and CT data were transferred to a workstation (VAZE: PetCommunications, Chuo, Osaka, Japan) to construct the 3D images. In the MRTD images, the cerebrospinal fluid, pleura, kidney (renal pelvis) (Fig. 1A and C), part of the vessels (caudal vena cava, hepatic vein, and portal vein), and gastric juice were shown. Unnecessary fluids were removed in the maximum intensity projection (MIP) imaging of MRTD (Fig. 1B and D). Furthermore, 3D image of the thoracic duct was reconstructed from MRTD images, and 3D images of bone, heart, vessel, and esophagus were reconstructed from CT images. Those images were superposed using the “fusion” function on the workstation. The cerebrospinal fluid, kidney (renal pelvis), aorta, and liver vein (hepatic vein and portal vein) were used as indices of the superpose methods (Fig. 2A–C). The number of thoracic ducts at each vertebra between C5 andL2 were recorded in transverse MRTD (Fig. 2C) and T2WI (Fig. 2D). Location in relation to aorta and the location of the branches of thoracic duct were noted where possible. The comparison of the number of thoracic ducts at each vertebra between transverse T2WI and MRTD was performed using Student’s t-test. Statistical significance was set at p < 0.05.
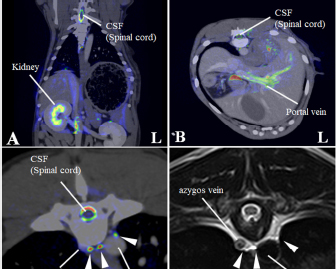
Fig. 2. Merged images from magnetic resonance thoracic ductography (MRTD) and contrast enhancement CT. The spinal cord, kidney, hepatic vein, aorta and portal vein were used as indices of the superpose method (A, B, C). The number of thoracic ducts at each vertebra between C5-L2 were recorded in transverse MRTD (C) and transverse T2-weighted image (D). (A) Fused image of the dorsal plane. (B) Fused image of the transverse plane. (C) Fused image of the transverse plane at the level of T7. Contrast enhancement CT image (monochrome); MRTD (rainbow). (D) T2-weighted image of the transverse plane at the level of T7. CSF: cerebrospinal fluid, white arrows (thoracic duct).
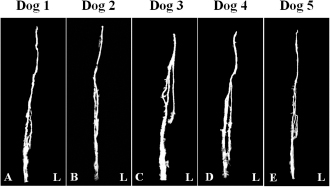
Fig. 3. Maximum intensity projection image of magnetic resonance thoracic ductography images of the dorsal plane. All dogs had thoracic duct branches. The right lymphatic duct was not found on the image in all dogs.
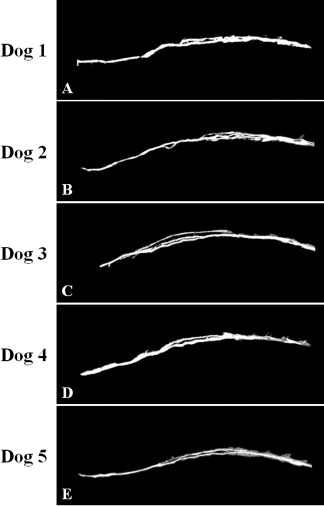
Fig. 4. Maximum intensity projection image of magnetic resonance thoracic ductography images of the lateral plane. The thoracic duct branches formed a ring ventrally, which was displayed in dog 2 only (B).
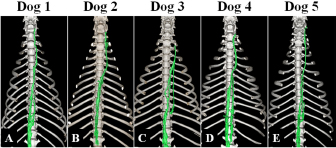
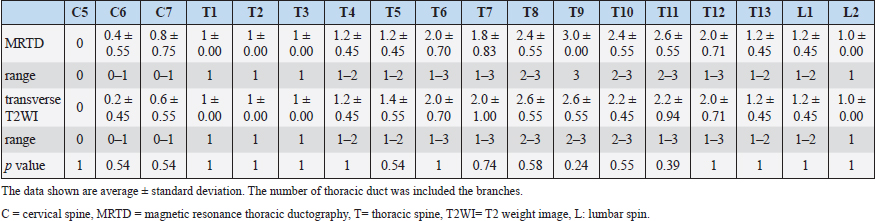
Fig. 5. Fused 3D image of magnetic resonance thoracic ductography images and contrast enhancement CT images of the ventrodorsal view. CT showed only the bones. Green region: thoracic duct. Ethical approvalExperimental protocols were approved by the Animal Care and Use Committee of Okayama University of Science. ResultsThe thoracic ducts were identified in MRTD images acquired from all of the dogs (Figs. 3–6). The average number of thoracic ducts at each vertebra between C5 and L2 is summarized in Table 1. The thoracic ducts in all dogs coursed along the right-dorsal side of the aorta, cranially from the L2 level (Fig. 6). Thereafter, these bent to the left side at the aortic arch and curved at the left external jugular vein angle (Fig. 6). The thoracic ducts between C5 and C7 were not found on images of any of the dogs (C5: all dogs, C6: 3 dogs, and C7: 1 dog) (Fig. 5 and Table 1). Thoracic duct branches of dogs were shown at levels between T4 and L1 (Fig. 5 and Table 1). Thoracic duct branches located on the left-dorsal side of aorta were confirmed in four dogs (except dog 2) (Fig. 6). Only dog 2 showed a branch of the thoracic duct to the ventral side that formed a ring (Fig. 4). The right lymphatic duct was not found on images in all dogs. A comparison of the number of thoracic ducts at each vertebra between transverse T2WI and MRTD did not reveal any significant differences for all vertebrae (Table 1). DiscussionIn this study, we provide evidence that our MRTD technique using the SS-FSE sequence modified for application in the mediastinum could aid in visualization of the thoracic duct. In a previous study using MRI in dogs, cisterna chyli and thoracic duct were visible as hyperintense structures on T2WI (Johnson and Seiler, 2006). This study also showed that the signals from liquid fractions were, especially, prominent on T2WI, and the other signals were dampened based on the principle that lymph flowing through the thoracic duct appears hyperintense. SS-FSE sequence is used for MR myelography in veterinary practices (Pease et al., 2006), which shows only cerebrospinal fluid due to a lack of signal from any substances except pure fluid. Normal SS-FSE of thorax is severely affected by artifacts produced by breathing-related movements. In our MRTD technique, SS-FSE sequence with respiratory gating was set to prevent motion artifacts due to breathing and led to significant improvement in the visualization of the thoracic duct. MRTD using the SS-FSE sequence also enabled 3D visualization, including MIP images by scanning consecutive thin imaging planes. The resolution of the SS-FSE sequence (spatial resolution=1 × 1 mm) was lower than that of transvers T2WI (spatial resolution=0.5×0.5 mm). In our study, the number of thoracic ducts depicted on MRTD was similar to that observed on transverse T2WI. Therefore, 3D-MRTD may be a superior method for the examination of 3D thoracic configuration.
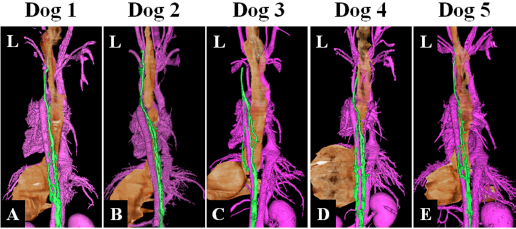
Fig. 6. Fused 3D image of magnetic resonance thoracic ductography images and contrast enhancement computed tomography images of the dorsoventral view. Green region: Thoracic duct. Pink region: cardiovascular system. Brown region: esophagus and stomach. In this study, MRTD produced clear images of various patterns of the thoracic duct. In previous study using radiographic lymphography, the patterns of the thoracic duct were classified into three patterns on the lateral plane and six patterns on the dorsoventral plane (Kagan and Breznock, 1979). When the results of this study were collated using this classification, one pattern was on the lateral plane and two patterns were on the dorsal plane. In this study, all dogs showed type A pattern (vascular loops forming numerous collaterals) (Kagan and Breznock, 1979) on the lateral plane (Fig. 4). On the dorsal plane, four dogs (dog 1, dog 2, dog 4, and dog 5) showed type A pattern (vascular loops forming numerous collated vessels) (Kagan and Breznock, 1979) (Fig. 3A, B, D and E) and one dog (dog 3) showed type B pattern (collateral vessels which crossed the midline at different levels) (Kagan and Breznock, 1979) (Fig. 3C). Because we used only five dogs in this study, a large-scale study is needed in order to classify the variation of the thoracic duct in MRTD. The fact that the SS-FSE sequence could only show fluid space due to a lack of signal from any substance except pure fluid (Esterline et al., 2005) is a major disadvantage of MRTD. As a result, positional relations between the thoracic duct and the surrounding tissues were lost. To remedy this, we performed vascular contrast-enhanced CT of the thorax and merged the resultant images with those acquired using MRTD to visualize the thoracic duct, bone, esophagus, blood vessels, and heart. Unlike the contrast-enhancement CT lymphography and radiographic lymphography (Ando et al., 2011; Birchard et al., 1982; Iwanaga et al., 2016; Johnson et al., 2009; Lee et al., 2012; Millward et al., 2011), the MRTD sequence does not require contrast medium injection into lymph tissues. Imaging methods that require a contrast agent are affected by the timing of scanning due to the dilution of such contrast agents over time. Additionally, contrast medium in lymphography could lead to pulmonary embolism in humans (Okuda et al., 2009). Therefore, the MRTD sequence is relatively safe and easy to carry out compared to the existing imaging methods. As a limitation of our study, a comparison between MRTD and CT lymphography was not performed. Furthermore, MRTD was not performed in clinical cases, such as those of chylothorax, esophageal tumor, and central lymphatic abnormalities. In humans, the MRTD image is used to identify an anomalous thoracic duct or any variations before thoracic surgery for conditions, like esophageal tumor (Oguma et al., 2018) and central lymphatic abnormalities (Biko et al., 2019). Damage to the thoracic duct could cause chylothorax, resulting in serious metabolic, immunologic, and nutritional complications (Fossum et al., 2004). These complications are associated with a mortality rate of up to 50% unless treated properly (McGrath et al., 2010). Therefore, visualization of the thoracic duct would provide beneficial information to guide surgical procedures. In addition, fused images from MRTD and vascular contrast-enhanced images of the thorax could provide anatomical insight for preoperative planning. Further studies are needed to compare image quality between MRTD and CT in dogs and to accumulate clinical evidence to determine whether MRTD can be used to guide treatment for thoracic diseases. In conclusion, the results of our study suggest that MRTD using an SS-FSE sequence may be a useful and safe technique for visualization of the thoracic duct. Furthermore, fused images obtained from MRTD and vascular contrast-enhanced images of the thorax could aid in visualization of anatomical structures in detail. AcknowledgmentThis work was supported by the research and education funds from Ehime Prefecture and Imabari City, Japan. Conflict of interestThe authors declare that there is no conflict of interest. Author’s contributionConceptualization: Kenji Kutara. Data curation: Kenji Kutara, Teppei Kanda, Noritaka Maeta, Yohei Mochizuki, Fumiko Ono, Yoshiki Itoh and Taketoshi Asanuma. Formal analysis: Kenji Kutara. Investigation: Kenji Kutara, Teppei Kanda, Noritaka Maeta, Yohei Mochizuki, Fumiko Ono, Yoshiki Itoh and Taketoshi Asanuma. Supervision: Kenji Kutara. Writing: Kenji Kutara. Approved by all the authors. Table 1. The average number of thoracic duct.
ReferencesAndo, K., Kamijyou, K., Hatinoda, K., Shibata, S., Shida, T. and Asari, M. 2011. Computed tomography and radiographic lymphography of the thoracic duct by subcutaneous or submucosal injection. J. Vet. Med. Sci. 74, 135–140. Bezuidenbout, A.J. 2013. The lymphatic system. In Miller’s anatomy of the dog, 4th ed. Ed., Lauhunta ED. St Louis, MO: Elsevier Saunders, pp: 535–562. Biko, D.M., Reisen, B., Otero, H.J., Ravishankar, C., Victoria, T., Glatz, A.C., Rome, J.J. and Dori, Y. 2019. Imaging of central lymphatic abnormalities in Noonan syndrome. Pediatr. Radiol. 49, 586–592. doi: 10.1007/s00247-018-04337-6. Birchard, S.J. and McLoughlin, M.A. 1998. Treatment of idiopathic chylothorax in dogs and cats. J. Am. Anim. Hosp. Assoc. 212, 652–657. Birchard, S.J., Cantwell, H.D. and Bright, R.M. 1982. Lymphangiography and ligation of the canine thoracic duct: a study in normal dogs and 3 dogs with chylothorax. J. Am. Anim. Hosp. Assoc. 18, 769–777. Esterline, M.L., Radlinsky, M.G., Biller, D.S., Mason, D.E., Roush, J.K. and Cash, W.C. 2005. Comparison of radiographic and computed tomography lymphangiography for identification of the canine thoracic duct. Vet. Radiol. Ultrasound 46, 391–395. Fossum, T.W., Mertens, M.M., Miller, M.W., Peacock, J.T., Saunders, A., Gordon, S., Pahl, G., Makarski, L.A., Bahr, A. and Hobson, P.H. 2004. Thoracic duct ligation and pericardectomy for treatment of idiopathic chylothorax. J. Vet. Intern. Med. 18, 307–310. Iwanaga, T., Tokunaga, S. and Momoi, Y. 2016. Thoracic duct lymphography by subcutaneous contrast agent injection in a dog with chylothorax. Open Vet. J. 6, 238–241. Johnson, E.G., Wisner, E.R., Kyles, A., Koehler, C. and Marks, S.L. 2009. Computed tomographic lymphography of the thoracic duct by mesenteric lymph node injection. Vet. Surg. 38, 361–367. Johnson, V.S. and Seiler, G. 2006. Magnetic resonance imaging appearance of the Cisterna chyli. Vet. Radiol. Ultrasound 47, 461–464. Kagan, K.G. and Breznock, E.M. 1979. Variation in the canine thoracic duct system and the effects of surgical occlusion demonstrated by rapid aqueous lymphography, using an intestinal lymphatic trunk. Am. J. Vet. Res. 40, 948–958. Kato, T., Takase, K., Ichikawa, H., Satomi, S. and Takahashi, S. 2011. Thoracic duct visualization: combined use of multidetector-row computed tomography and magnetic resonance imaging. J. Comput. Assist. Tomogr. 35, 260–265. Lee, N., Won, S., Choi, M., Kim, J., Yi, K., Chang, D., Choi, M. and Yoon, J. 2012. CT thoracic duct lymphography in cats by popliteal lymph node iohexol injection. Vet. Radiol. Ultrasound 53, 174–180. McGrath, E.E., Blades, Z. and Anderson, P.B. 2010. Chylothorax: aetiology, diagnosis and therapeutic options. Respir. Med. 104, 1–8. Millward, I.R., Kirberger, R.M. and Thompson, P.N. 2011. Comparative popliteal and mesenteric computed tomography lymphangiography of the canine thoracic duct. Vet. Radiol. Ultrasound 52, 295–301. Oguma, J., Ozawa, S., Kazuno, A., Nitta, M., Ninomiya, Y., Yatabe, K., Niwa, T. and Nomura, T. 2018. Clinical significance of new magnetic resonance thoracic ductography before thoracoscopic esophagectomy for esophageal cancer. World J. Surg. 42, 1779–1786. Okuda, I., Udagawa, H., Takahashi, J., Yamase, H., Kohno, T. and Nakajima, Y. 2009. Magnetic resonance-thoracic ductography: imaging aid for thoracic surgery and thoracic duct depiction based on embryological considerations. Gen. Thorac. Cardiovasc. Surg. 57, 640–646. Pease, A., Sullivan, S., Olby, N., Galano, H., Cerda-Gonzalez, S., Robertson, I.D., Gavin, P. and Thrall, D. 2006. Value of a single-shot turbo spin-echo pulse sequence for assessing the architecture of the subarachnoid space and the constitutive nature of cerebrospinal fluid. Vet. Radiol. Ultrasound 47, 254–259. Takahashi, H., Kubokawa, S., Abe, H., Aoki, T., Miyazaki, M. and Nakata, H. 2003. Clinical feasibility of noncontrast enhanced magnetic resonance lymphography of the thoracic duct. Chest. 124, 2136–2142. | ||

| How to Cite this Article |
| Pubmed Style KK, TK, NM, YM, FO, YI, TA, . Combining non-contrast enhanced magnetic resonance thoracic ductography with vascular contrast-enhanced computed tomography to identify the canine thoracic duct . Open Vet J. 2020; 10(1): 68-73. doi:10.4314/ovj.v10i1.11 Web Style KK, TK, NM, YM, FO, YI, TA, . Combining non-contrast enhanced magnetic resonance thoracic ductography with vascular contrast-enhanced computed tomography to identify the canine thoracic duct . https://www.openveterinaryjournal.com/?mno=69661 [Access: October 06, 2024]. doi:10.4314/ovj.v10i1.11 AMA (American Medical Association) Style KK, TK, NM, YM, FO, YI, TA, . Combining non-contrast enhanced magnetic resonance thoracic ductography with vascular contrast-enhanced computed tomography to identify the canine thoracic duct . Open Vet J. 2020; 10(1): 68-73. doi:10.4314/ovj.v10i1.11 Vancouver/ICMJE Style KK, TK, NM, YM, FO, YI, TA, . Combining non-contrast enhanced magnetic resonance thoracic ductography with vascular contrast-enhanced computed tomography to identify the canine thoracic duct . Open Vet J. (2020), [cited October 06, 2024]; 10(1): 68-73. doi:10.4314/ovj.v10i1.11 Harvard Style , K. K. ., , T. K. ., , N. M. ., , Y. M. ., , F. O. ., , Y. I. ., , T. A. . & (2020) Combining non-contrast enhanced magnetic resonance thoracic ductography with vascular contrast-enhanced computed tomography to identify the canine thoracic duct . Open Vet J, 10 (1), 68-73. doi:10.4314/ovj.v10i1.11 Turabian Style , Kenji Kutara , Teppei Kanda, Noritaka Maeta, Yohei Mochizuki, Fumiko Ono, Yoshiki Itoh, Taketoshi Asanuma, and . 2020. Combining non-contrast enhanced magnetic resonance thoracic ductography with vascular contrast-enhanced computed tomography to identify the canine thoracic duct . Open Veterinary Journal, 10 (1), 68-73. doi:10.4314/ovj.v10i1.11 Chicago Style , Kenji Kutara , Teppei Kanda, Noritaka Maeta, Yohei Mochizuki, Fumiko Ono, Yoshiki Itoh, Taketoshi Asanuma, and . "Combining non-contrast enhanced magnetic resonance thoracic ductography with vascular contrast-enhanced computed tomography to identify the canine thoracic duct ." Open Veterinary Journal 10 (2020), 68-73. doi:10.4314/ovj.v10i1.11 MLA (The Modern Language Association) Style , Kenji Kutara , Teppei Kanda, Noritaka Maeta, Yohei Mochizuki, Fumiko Ono, Yoshiki Itoh, Taketoshi Asanuma, and . "Combining non-contrast enhanced magnetic resonance thoracic ductography with vascular contrast-enhanced computed tomography to identify the canine thoracic duct ." Open Veterinary Journal 10.1 (2020), 68-73. Print. doi:10.4314/ovj.v10i1.11 APA (American Psychological Association) Style , K. K. ., , T. K. ., , N. M. ., , Y. M. ., , F. O. ., , Y. I. ., , T. A. . & (2020) Combining non-contrast enhanced magnetic resonance thoracic ductography with vascular contrast-enhanced computed tomography to identify the canine thoracic duct . Open Veterinary Journal, 10 (1), 68-73. doi:10.4314/ovj.v10i1.11 |

