


| Research Article | ||
Open Vet. J.. 2024; 14(12): 3449-3459 Open Veterinary Journal, (2024), Vol. 14(12): 3449-3459 Research Article Evaluation of renal function in dogs using pulsed Doppler ultrasonographyTakami Ito, Kiwamu Hanazono*, Kenjirou Miyoshi and Daiji EndohSchool of Veterinary Medicine, Rakuno Gakuen University, Ebetsu, Japan *Corresponding Author: Kiwamu Hanazono. School of Veterinary Medicine, Rakuno Gakuen University, Ebetsu, Japan. Email: k-hanazono [at] rakuno.ac.jp Submitted: 19/08/2024 Accepted: 07/11/2024 Published: 31/12/2024 © 2024 Open Veterinary Journal
AbstractBackground: In human medicine, efforts have been made to evaluate venous blood flow in the kidneys to diagnose renal disease and estimate renal function. In dogs, previous studies have predicted renal function using the resistive index (RI) and pulsatility index (PI), which are derived from renal arterial blood flow velocity assessed via pulsed Doppler ultrasonography. However, to date, no study has been conducted on renal venous blood flow velocity in dogs. Aim: To investigate the relationship between renal venous blood flow velocity and renal function. Methods: Ten normal beagle dogs underwent blood tests and glomerular filtration rate (GFR) measurements. Pulsed Doppler ultrasonography was performed under sedation to measure the maximum venous flow velocity (Vmax), minimum venous flow velocity (Vmin), and venous impedance index in the renal and interlobular veins. The RI and PI were calculated from the renal and interlobular arteries. Results: Vmax and Vmin of the renal vein were negatively correlated with GFR in both kidneys. No significant correlations were found between other measures and GFR. These results suggest a relationship between GFR and venous flow velocity in the renal veins assessed using pulsed Doppler ultrasonography. Conclusion: These findings demonstrate the potential of this methodology as a new tool for predicting abnormalities in the renal venous blood flow and renal congestion in dogs. Further large-scale studies and comparisons between healthy dogs and dogs with impaired renal function are needed to validate this relationship. Keywords: Doppler ultrasonography, Glomerular filtration rate, Renal venous blood flow velocity, Beagle dogs. IntroductionChronic kidney disease (CKD) is a progressive renal dysfunction that affects 0.5%–1.5% of dogs. Early detection and treatment are crucial because they can delay CKD progression (Lefebvre, 2011; Polzin, 2013; Zatelli et al., 2016). Serum creatinine (Cr) concentration is commonly used in veterinary clinical practice as an indicator of renal function. However, its sensitivity and specificity are low because its concentration does not increase significantly until at least 65%–75% of renal function is lost (Lefebvre, 2011). A comprehensive assessment of renal function involves measuring the glomerular filtration rate (GFR) using tests such as inulin (Heiene and Moe, 1998; Nishida et al., 2012) or iohexol clearance test (Finco et al., 2001). However, these methods are complex and expensive, making them rarely used in daily clinical practice. Similarly, scintigraphy using 99mTc-diethylenetriamine pentaacetic acid can be employed to evaluate the GFR of each kidney; however, it requires special licensing and equipment for handling radioactive isotopes, limiting the number of facilities capable of performing this test (Lefebvre, 2011; O’Neill et al., 2013). Symmetrical dimethylarginine (SDMA) and cystatin C levels serve as alternatives to GFR for assessing renal function. Elevated levels of these biomarkers indicate a reduced GFR and aid in the early detection of CKD (McKenna et al., 2020). Specifically, SDMA shows a high correlation with GFR in patients with impaired renal function (Pelander et al., 2019; McKenna et al., 2020). However, while SDMA reflects overall renal function, it cannot distinguish between the functions of the individual kidneys. In clinical practice, it may be necessary to assess the function of both affected and contralateral kidneys to determine the appropriate course of action, such as nephrectomy, in patients with renal tumors and hydronephrosis (Gookin et al., 1996). Techniques enabling the assessment of individual functions involve calculating the pulsatility index (PI) and resistive index (RI) using pulsed Doppler ultrasonography. In human medicine, the RI and PI of blood flow velocity in the renal arteries have demonstrated correlations with GFR and Cr levels, serving as indicators of renal function (Ohkuma et al., 1993; Mastorakou et al., 1994; Vigna et al., 1996; Petersen et al., 1997; Radermacher et al., 2001; Ohta et al., 2005; Sugiura and Wada, 2009; Ohuchi et al., 2013). In veterinary medicine, studies have explored renal RI and PI in both healthy and diseased dogs and cats, including those with CKD and obstructive urinary tract conditions (Nyland et al., 1993; Morrow et al., 1996; Rivers et al., 1997; Choi et al., 2003; Novellas et al., 2007a; Novellas et al., 2007b; Novellas et al., 2010; Tipisca et al., 2016; Bragato et al., 2017). In human medicine, efforts have been made to evaluate venous blood flow in the kidneys. In cases of renal obstruction, the alteration in venous blood flow surpasses that of arterial blood flow within the kidney. The venous impedance index (VII) value of the kidney has proven to be valuable in distinguishing between acute and chronic obstruction (Bateman and Cuganesan, 2002; Oktar et al., 2004). In addition, studies have indicated that renal VII tends to be lower in patients with diabetic nephropathy than in controls and correlates with serum Cr concentration, thereby reflecting renal function in diabetic nephropathy (Jeong et al., 2011; Kudo et al., 2017). However, to the best of our knowledge, these validations have not been previously attempted in veterinary medicine. In veterinary medicine, there exists a condition known as cardiovascular–renal axis disorder (CvRD). This disorder suggests that several cardiovascular issues, such as systemic hypertension, cardiac shock, low cardiac output, systemic hypotension, systemic arterial thromboembolism, myocardial infarction, and passive renal congestion during heart failure, can lead to a decline in renal function and CKD (Pouchelon et al., 2015). In human medicine, Ronco et al. (2008) were the first to describe cardiorenal syndrome (CRS), wherein reduced cardiac function subsequently results in decreased renal function (Ronco et al., 2008). This pathological condition is hypothesized to be caused by both a reduction in renal blood flow associated with decreased cardiac output, and alterations in nerves and hormones linked to decreased left ventricular function. As a result, renal function declines, mimicking the mechanism observed in CvRD in veterinary medicine. The assessment of venous blood flow in the kidneys using Doppler ultrasonography has been applied in human medicine to diagnose renal congestion and CRS (Iida et al., 2016; Nijst et al., 2017; Puzzovivo et al., 2018). We hypothesized that renal venous blood flow is closely related to GFR and that changes in the renal venous flow waveform are associated with a decrease in GFR, which in turn correlates with alterations in Vmax, Vmin, and VII. In this study, we investigated the relationship between GFR and venous flow waves in the interlobar and renal veins using pulsed Doppler ultrasonography. Furthermore, as a pilot study for the clinical application of renal venous blood flow assessment, we compared this relationship with existing biomarkers of renal function and ultrasonographic indices obtained from measurements of the renal arterial blood flow velocity. Materials and MethodsAnimalsThis pilot study involved 10 normal dogs, consisting of five intact males and five intact females, ensuring a sufficient representation of both sexes for statistical analysis. All the dogs were housed together in the same kennel and underwent preliminary physical examinations, complete blood count evaluations, and blood chemistry tests to confirm their normal health status. Prior to the experiment, the dogs did not receive any medication and were fasted for 12 hours. Blood test and inulin clearance testBlood was collected from either the left or right cephalic vein and centrifuged to separate the serum immediately prior to the inulin clearance test, as outlined next. Blood urea nitrogen (BUN) and Cr levels were measured using an enzymatic method. Cystatin C levels were measured at a commercial laboratory (FUJIFILM VET Systems, Tokyo, Japan) using the latex agglutination method, while serum SDMA was determined at another laboratory (IDEXX Laboratories, Tokyo, Japan) using an immunoassay. Immediately after blood sampling, an inulin clearance test was conducted to estimate the GFR, utilizing a method specified by the contracted commercial laboratory (FUJIFILM VET Systems, Tokyo, Japan). The dogs received an injection of 100 mg/kg inulin (INULEAD Inj, Fuji Yakuhin, Saitama, Japan) via an indwelling needle into the vein. Blood samples were obtained from the jugular vein at 2- and 3-hour intervals following inulin administration, and these samples were then centrifuged to isolate serum. Each serum sample was evaluated by the contracted laboratory using the enzyme method, and the inulin clearance was subsequently calculated. Furthermore, GFR was calculated after adjusting the inulin clearance based on body weight (with a reference range of 2.7–5.3 ml/minute/kg). In addition, the renal functional reserve was determined as the percentage of the measured GFR value when setting the lower limit of normal GFR (2.7 ml/minute/kg) at 100%. UltrasonographyUltrasonography was conducted by a trained inspector. Following the inulin clearance test, the dogs were administered 0.1 mg/kg of midazolam (Midazolam injection 10 mg [SANDOZ], Sandoz Japan, Tokyo, Japan) and 0.2 mg/kg of butorphanol (Vetorphale 5 mg, Meiji Seika Pharma, Tokyo, Japan) intravenously. The dogs were positioned in the right lateral decubitus posture, and their left kidneys were visualized using a convex transducer. Ultrasonographic findings were captured using an imaging system (ARIETTA 70; Hitachi Aloka Medical, Tokyo, Japan). A color Doppler was employed to identify the blood vessels. We conducted recordings of blood flow waveforms in the interlobar and renal vessels during exhalation using pulsed Doppler ultrasonography (sample volume=1.0–2.0 mm and frequency=8 MHz) with electrocardiogram gating. Typically, the arterial blood flow waveform exhibits continuity, featuring a sharp peak toward the transducer in the near field of the renal pelvis during systole, followed by a gradual decrease in flow velocity, reaching its slowest point at end-diastole. Conversely, the venous waveform typically presents as a continuous and relatively flat flow pattern, moving away from the transducer in the near field of the renal pelvis, with a rapid wave observed after each ventricular contraction (Szatmári et al., 2001). Following a standardized procedure, the dogs were positioned in the left lateral decubitus posture and the blood flow waveform of the right kidney was recorded using the same methodology. From these waveforms, various parameters, including peak systolic velocity (PSV), end-diastolic velocity (EDV), time-averaged maximum velocity (TAMV), RI, and PI for both the renal interlobar and renal arteries, were extracted. In this study, venous blood flow waveforms were categorized into continuous and discontinuous patterns, as outlined by Iida et al (Iida et al., 2016). Furthermore, additional metrics, such as the maximum venous flow velocity (Vmax), minimum venous flow velocity (Vmin), and venous impedance index (VII), were determined from the blood flow waveforms observed in renal and renal interlobar veins. Each parameter was measured across the three waveforms, and their average values were calculated (Fig. 1). For all the blood vessels examined, the Doppler incident angle remained within 60°, with a correction angle within 30°. The RI, PI, and VII were calculated using the following formulas: RI=(PSV − EDV)/PSV PI=(PSV − EDV)/TAMV VII=(Vmax − Vmin)/Vmax. Blood pressure measurementThe dogs were held in the right lateral recumbent position, a cuff was attached to the right tarsal joint, and the oscillometric method was applied. Blood pressure was measured three times before and after sedation, and the average value of the systolic blood pressure [reference range 150 ± 20 mmHg (Stepien and Rapoport, 1999)], diastolic blood pressure [reference range 71 ± 18 mmHg (Stepien and Rapoport, 1999)], and mean blood pressure [reference range 108 ± 15 mmHg (Stepien and Rapoport, 1999)] was calculated using a biological monitoring device (BP-88v, Omron Healthcare, Kyoto, Japan). The American College of Veterinary Internal Medicine consensus statement states that in accordance with the guidelines, hypertension is defined as a systolic blood pressure of 160 mmHg or more (Acierno et al., 2018). Statistical analysisNormality was assessed using histograms, quantile-to-quantile plots, and Shapiro–Wilk normality tests. Parametric tests were used for data with a normal distribution, and nonparametric tests were used for data that did not follow a normal distribution. Pearson’s correlation coefficient (a parametric test) or Spearman’s rank correlation coefficient (a nonparametric test) was used to assess the correlations between GFR and biomarkers and ultrasonographic parameters. Student’s t-test (a parametric test) and Mann–Whitney U test (a nonparametric test) were used to examine differences between the left and right kidneys, as well as differences in blood pressure before and after sedation for each average calculated value. For statistical analysis, free statistical software (R: A Language and Environment for Statistical Computing, version 3.6.0, R Foundation for Statistical Computing, Vienna, Austria) was used, and p-values < 0.05 were considered as significant.
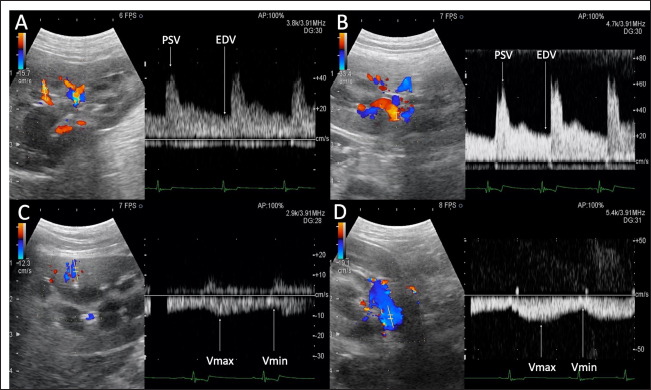
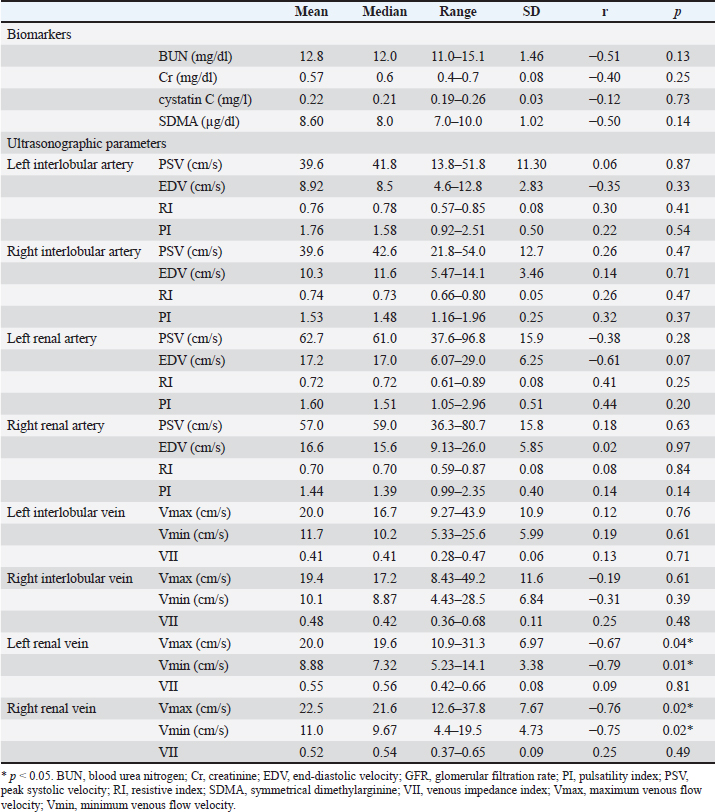
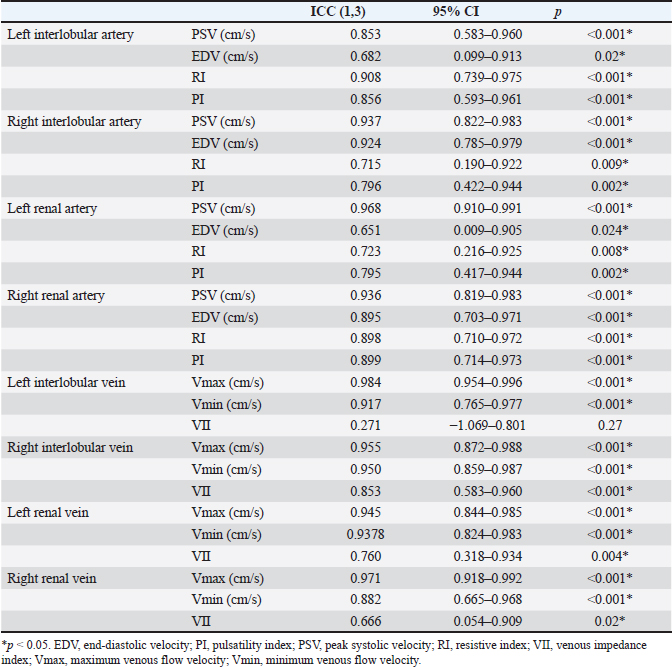
Fig. 1. Renal blood flow waveform on pulsed Doppler ultrasonography. Flow waveform of the renal interlobar artery (A), renal artery (B), renal interlobar vein (C), and renal vein (D). The arterial blood flow waveform peaks sharply and quickly during systole (PSV), after which the flow velocity gradually slows to a minimum at end-diastole (EDV). The venous blood flow waveform is continuous, with the fastest waveform (Vmax), followed by a gradual slowing to a minimum (Vmin). EDV, end-diastolic velocity; PSV, peak systolic velocity; Vmax, maximum venous flow velocity; Vmin, minimum venous flow velocity. One-way random-effects intraclass correlation (ICC1,3) was used to assess the intraobserver agreement of each measurement. The level of reliability was defined as poor (ICC < 0.5), moderate (0.5 < ICC < 0.75), good (0.75 < ICC < 0.9), or excellent (ICC > 0.9) for intraobserver reliability (Koo and Li, 2016). For such analysis, commercial statistical software (BellCurve for Excel, Social Survey Research Information, Tokyo, Japan) was used, and p-values < 0.05 were considered as statistically significant. Ethical approvalThis pilot study was prospectively designed in accordance with the replacement, reduction, and refinement (3R) principle and was approved by the Rakuno Gakuen Animal Experiment Committee (approval number: VH18B9). ResultsThe median age of the 10 dogs was 5 years (range: 4–8 years), and the median weight was 11.2 kg (range: 9.2–14.2 kg). In the current study, there was no opportunity to use parametric tests when comparing the two items because either both were not normally distributed or only one had a normal distribution. Therefore, only nonparametric tests were used in this study. Before and after sedation, the median systolic blood pressure was 144.5 mmHg (range: 128–160 mmHg) and 122.5 mmHg (range: 101–159 mmHg), the median diastolic blood pressure was 77.0 mmHg (range: 68–112 mmHg) and 66.0 mmHg (range: 56–86 mmHg), and the median and mean blood pressure were 99.5 mmHg (range: 79–133 mmHg) and 85.0 mmHg (range: 68–100 mmHg), respectively. With no sedation, one patient had a systolic blood pressure of 160 mmHg. However, under sedation, all patients had a systolic blood pressure of less than 160 mmHg. In addition, significant reductions in systolic, diastolic, and mean blood pressure were observed after sedation (p=0.04, 0.04, and 0.03, respectively). The median GFR was 5.65 ml/minute/kg (range: 2.2–7.8 ml/minute/kg), while the renal functional reserve was 81.5% in one case and >100% in the remaining nine cases. There were no significant correlations between the GFR and renal function markers (Table 1). The renal vein blood flow waveform showed a continuous pattern in all cases. The Vmax (r=−0.67 and p=0.04) and Vmin (r=−0.79 and p=0.01) of the left renal vein showed a significant negative correlation with body-weight-standardized GFR. Similarly, Vmax (r=−0.76 and p=0.02) and Vmin (r=−0.75 and p=0.02) of the right renal vein also displayed a significantly negative correlation with GFR (Table 1 and Fig. 2). The VII of the renal veins; Vmin, Vmax, and VII of the renal interlobar veins; and the PI, RI, PSV, and EDV of the renal and renal interlobar arteries were not significantly correlated with GFR. No significant differences were observed between the left and right kidneys in the interlobar artery/vein or renal artery/vein (Table 1). Interlobar arterial/venous and renal arterial/venous measurements showed no significant differences between the left and right kidneys (p > 0.05). Also, no adverse events were observed in the study. The intraobserver reliabilities of PSV, PI, Vmax, and Vmin were good or excellent at all sites. Only the intraobserver reliability of VII for the left interlobular vein was poor (Table 2). DiscussionThe hypothesis of this study was that renal venous blood flow is closely related to GFR and that changes in the renal venous blood flow waveform are associated with a decrease in GFR, resulting in changes in Vmax, Vmin, and VII. Thus, Vmax and Vmin in the renal veins were negatively correlated with the GFR. In contrast, no change in the renal vein waveform was observed in the dogs. In addition, VII and renal venous flow velocity in the interlobar veins were not significantly correlated with GFR. Nijst et al. (2017) reported that discontinuous patterns were observed in approximately 80% of patients with heart failure and that the percentage decreased to approximately 30% with diuretic treatment. In contrast, they reported that no discontinuous pattern was observed in normal patients (Nijst et al., 2017). These results suggest that discontinuous patterns are seen in renal congestion associated with heart failure, and such discontinuous patterns are not observed in normal patients. In humans, renal venous flow evaluation using pulsed Doppler ultrasonography aids in the diagnosis of diabetic neuropathy, obstructive urinary tract disease, and pre-eclampsia (Bateman and Cuganesan, 2002; Bateman et al., 2004; Oktar et al., 2004; Jeong et al., 2011; Kudo et al., 2017). In diabetic nephropathy and obstructive urinary tract disease, VII is low (i.e., the change in Vmax is relatively decreased (Bateman and Cuganesan, 2002; Oktar et al., 2004; Jeong et al., 2011; Kudo et al., 2017), whereas in pre-eclampsia, VII is high [i.e., the change in Vmax is relatively increased (Bateman et al., 2004)]. In other words, a change in VII is accompanied by a change in the waveform. In a previous study, waveform changes were found to be caused by increases in downstream resistance, reductions in the pressure gradient between the renal veins and the right atrium, and increases in venous compliance (Bateman et al., 2004; Jeong et al., 2011). However, this study was based on normal dogs. Thus, VII may not have been affected because there were no pathological conditions among the patients in the current investigation that could have caused waveform changes. Table 1. Correlation between GFR, biomarkers, and ultrasonographic parameters.
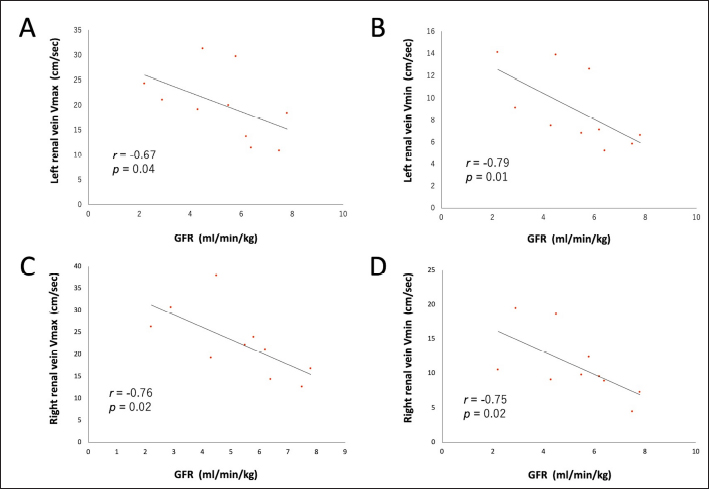
Fig. 2. Correlation between renal venous blood flow velocity and GFR. Linear associations between (A) left renal vein Vmax, (B) left renal vein Vmin, (C) right renal vein Vmax, and (D) right renal vein Vmin and GFR in 10 dogs. GFR, glomerular filtration rate; Vmax, maximum venous flow velocity; Vmin, minimum venous flow velocity. In terms of venous flow velocity, there was a significant negative correlation between Vmax and Vmin in the renal vein and GFR. However, there are no reports on the relationship between Vmax and Vmin, GFR, or renal function. In human medicine, a negative correlation has been observed between central venous pressure (CVP) and GFR in patients with heart failure (Damman et al., 2007), and it has been reported that hypervolemia therapy using an albumin solution reduces GFR (Mayer et al., 1998). Although the relationship between renal venous flow velocity and CVP is unclear, it has been shown that systolic and diastolic forward velocities in the inferior vena cava are reduced in human-simulated hypovolemia (Liu et al., 2006). In dogs, the systolic velocity directed toward the heart in the hepatic vein increases with an increase in CVP due to fluid loading, indicating a positive correlation with CVP (Nelson et al., 2010). These findings suggest that the increase in renal venous pressure associated with increased CVP may increase renal venous blood flow velocity while decreasing GFR. Although CVP was not measured in this study, it is speculated that the renal venous flow velocity might have a negative correlation with GFR, thereby reflecting the effect of CVP on GFR. In addition, no changes in the renal venous flow waveform or VII with GFR were observed, but changes in Vmax and Vmin of the renal vein may be useful in detecting early renal congestion when no changes are observed. In contrast, the range of GFR in the dogs in this study was relatively wide (2.2–7.8 ml/minute/kg), while the range below the reference value (<2.7 ml/minute/kg) was narrow. Therefore, in primary renal disease with substandard GFR, it may be more challenging to detect or identify clinically meaningful differences in renal venous flow velocity, owing to the narrower range of GFR. In human medicine, interlobar veins are often used to evaluate the renal venous flow (Bateman and Cuganesan, 2002; Bateman et al., 2004; Oktar et al., 2004; Jeong et al., 2011; Iida et al., 2016; Kudo et al., 2017; Puzzovivo et al., 2018; Meier et al., 2018). However, this study found no correlation between venous flow velocity in the interlobar veins and the GFR. This may be attributed to the large standard deviations of Vmax and Vmin in the interlobar vein (relative to those in the renal vein) in dogs. Specifically, in dogs, the interlobar veins are very thin, and blood flow signals are weak. Therefore, it is possible that interlobar venous flow could not be properly measured in the current study because it easily deviated from the sample volume owing to respiratory movement. Table 2. Intraclass correlation (ICC1,3) of the intraobserver reliability for each measurement.
RI has been studied as an indicator of renal function and has been shown to correlate with GFR in patients with CKD (Sugiura and Wada, 2009; Parolini et al., 2009; Bigé et al., 2012; Hanamura et al., 2012). Although RI reportedly increases in CKD-affected dogs (Morrow et al., 1996), there are few veterinary reports on RI as an indicator of renal function, and its association with GFR remains unclear. In the present study, RI did not correlate with GFR in healthy dogs, suggesting that RI does not reflect GFR in the absence of renal dysfunction. Similarly, BUN, Cr, cystatin C, and SDMA levels measured by blood tests did not correlate with the GFR. Serum SDMA levels are a biomarker of renal function and are elevated by approximately 20% when the renal function is lost (Nabity et al., 2015). In a previous study conducted on 10 dogs that underwent heminephrectomy or five-sixths nephrectomy, plasma SDMA concentrations displayed a robust increment with a smaller residual renal volume and were negatively correlated with GFR due to inulin clearance (Tatematsu et al., 2007). In CKD-affected dogs, SDMA has been found to be negatively correlated with GFR, as per the iohexol clearance test (Nabity et al., 2015; Hall et al., 2016). Furthermore, a recent report by McKenna et al. (2020) showed a negative correlation between SDMA and GFR owing to iohexol clearance in dogs without azotemia (McKenna et al., 2020). Based on these reports, SDMA can be considered a biomarker that accurately reflects the GFR. However, in this study, we did not find a significant correlation between SDMA and GFR, which may be because all previous reports included targeted cases of decreased renal function. McKenna et al. (2020) reported that GFR decreased by 20% or more in their subjects (McKenna et al., 2020). In the present study, only one dog had a GFR of 81.5%, and the remaining nine dogs had GFR values of 100%, which may explain the lack of association with SDMA concentrations. However, the association of renal venous blood flow velocity with GFR may reflect an increased CVP. In addition, a relationship between renal venous flow and renal function in humans with diabetic nephropathy and obstructive urinary tract disease has been observed in conditions other than heart disease. These human studies suggest that elevated ureteral pressure and renal parenchymal fibrosis due to chronic inflammation and ischemia may alter perivenous tissue compliance (Bateman and Cuganesan, 2002; Bateman et al., 2004; Oktar et al., 2004; Jeong et al., 2011; Kudo et al., 2017). Renal venous blood flow velocity may show different results depending on the cause of CKD and the presence of right heart failure. In the present study, there was no correlation between GFR and the indices SDMA, RI, and PI, which have been previously shown to correlate with renal disease. This indicates that the conclusions drawn from the renal venous blood flow velocity and GFR correlation in the present study are not clinically meaningful in renal disease that is not associated with cardiac disease. The limitations of this study include the small number of subjects, possible effects of sedation, lack of cardiac function evaluation, and lack of studies on diseased cases. Although there was a significant correlation between renal venous velocities and GFR in the current study, the correlation coefficients were low. Therefore, it is necessary to reassess the correlations within a larger sample size in future studies. Although this study revealed a correlation between GFR and venous blood flow in the renal vein (outside the renal capsule), human medicine mainly evaluates venous blood flow in the interlobular vein (inside the renal capsule), and it cannot be denied that the conclusions drawn from human medicine may not apply to dogs. When animals are not sedated, their body movements and panting make it difficult to record the measurements. Thus, sedation can help avoid this problem and shorten examination time. A previous study on normal beagles reported that sedation with midazolam and butorphanol significantly reduced systolic blood pressure and increased RI and PI in the renal interlobar artery (Novellas et al., 2007a,b). In the present study, sedated animals showed decreased blood pressure. It is unclear how midazolam and butorphanol affect renal venous flow in dogs. Nonetheless, their adverse effects on the renal venous flow cannot be ruled out. In addition, although renal venous blood flow was assessed by one observer in this study, further measurements by multiple observers should be performed to assess the reproducibility of this method and to investigate interobserver error. It must be noted that since this is only a pilot study investigating the relationship between renal venous blood flow and GFR, it may provide useful information for future research. ConclusionIn conclusion, this study showed a significant negative correlation between GFR and renal venous blood flow in the renal veins of normal dogs, indicating that the measurement of renal venous blood flow velocity by Doppler ultrasonography may be used to evaluate the effect of venous circulation on GFR. In contrast, in the present study, the GFR and renal function biomarkers in blood tests, RI and PI, were not found to be associated with GFR. Therefore, the evaluation of renal venous blood flow velocity has minor relevance to primary renal disease and may reflect renal congestion associated with elevated CVP. Renal venous blood flow velocity in the renal veins may reflect early renal congestion with poor changes in the renal venous blood flow waveform and VII and may be useful for the early diagnosis of renal congestion. In future studies, it will be necessary to compare healthy animals with those affected by heart and renal diseases to verify the results of the present study and to increase the generalizability of our findings. AcknowledgmentsThe authors thank Kohei Makita (School of Veterinary Medicine) for his cooperation and support during the study. This study was funded by individual research funds allocated to faculty members at the Rakuno Gakuen University. Conflict of interestThe authors declare that they have no conflict of interest. FundingThis research received no specific grant. Authors’ contributionsTakami Ito: blood collection, sedation, ultrasonography, and writing of the original draft. Kiwamu Hanazono: conceptualization, statistical analysis, and editing. Kenjiro Miyoshi: health evaluation of dogs. Daiji Endo: supervision. Data availabilityMore detailed data regarding the results of this study are available from the authors upon request. ReferencesAcierno, M.J., Brown, S., Coleman, A.E., Jepson R.E., Papich, M., Stepien, RL. and Syme, H.M. 2018. ACVIM consensus statement: guidelines for the identification, evaluation, and management of systemic hypertension in dogs and cats. J. Vet. Intern. Med. 32, 1803–1822. Bateman, G.A. and Cuganesan, R. 2002. Renal vein Doppler sonography of obstructive uropathy. AJR Am. J. Roentgenol. 178, 921–925. Bateman, G.A., Giles, W. and England, S.L. 2004. Renal venous Doppler sonography in preeclampsia. J. Ultrasound Med. 23, 1607–1611. Bigé, N., Lévy, P.P., Callard, P., Faintuch, J.M, Chigot, V., Jousselin, V., Ronco, P. and Boffa, J.J. 2012. Renal arterial resistive index is associated with severe histological changes and poor renal outcome during chronic kidney disease. BMC Nephrol. 13, 139. Bragato, N., Borges, N.C. and Fioravanti, M.C.S. 2017. B-mode and Doppler ultrasound of chronic kidney disease in dogs and cats. Vet. Res. Commun. 41, 307–315. Choi, H., Won, S., Chung, W. Lee, K., Chang, D., Lee, H., Eom, K., Lee, Y. and Yoon, J. 2003. Effect of intravenous mannitol upon the resistive index in complete unilateral renal obstruction in dogs. J. Vet. Intern. Med. 17, 158–162. Damman, K., Navis, G., Voors, A.A., Asselbergs, F.W., Smilde, T.D., Cleland, J.G., van Veldhuisen, D.J. and Hillege, H.L. 2007. Worsening renal function and prognosis in heart failure: systematic review and meta-analysis. J. Card. Fail. 13, 599–608. Finco, D.R., Braselton, W.E. and Cooper, T.A. 2001. Relationship between plasma iohexol clearance and urinary exogenous creatinine clearance in dogs. J. Vet. Intern. Med. 15, 368–373. Gookin, J.L., Stone, E.A., Spaulding, K.A. and Berry, C.R. 1996. Unilateral nephrectomy in dogs with renal disease: 30 cases (1985-1994). J. Am. Vet. Med. Assoc. 208, 2020–2026. Hall, J.A., Yerramilli, M., Obare, E., Yerramilli, M., Almes, K. and Jewell, D.E. 2016. Serum concentrations of symmetric dimethylarginine and creatinine in dogs with naturally occurring chronic kidney disease. J. Vet. Intern. Med. 30, 794–802. Hanamura, K., Tojo, A., Kinugasa, S., Asaba, K. and Fujita, T. 2012. The resistive index is a marker of renal function, pathology, prognosis, and responsiveness to steroid therapy in chronic kidney disease patients. Int. J. Nephrol. 2012, 139565. Heiene, R. and Moe, L. 1998. Pharmacokinetic aspects of measurement of glomerular filtration rate in the dog: a review. J. Vet. Intern. Med. 12, 401–414. Iida, N., Seo, Y., Sai, S., Machino-Ohtsuka, T., Yamamoto, M., Ishizu, T., Kawakami, Y. and Aonuma, K. 2016. Clinical implications of intrarenal hemodynamic evaluation by Doppler ultrasonography in heart failure. JACC Heart Fail. 4, 674–682. Jeong, S.H., Jung, D.C., Kim, S.H. and Kim, S.H. 2011. Renal venous Doppler ultrasonography in normal subjects and patients with diabetic nephropathy: value of venous impedance index measurements. J. Clin. Ultrasound. 39, 512–518. Koo, T.K. and Li, M.Y. 2016. A guideline of selecting and reporting intraclass correlation coefficients for reliability research. J. Chiropr. Med. 15, 155–163. Kudo, Y., Mikami, T., Nishida, M., Okada, K., Kaga, S., Masauzi, N., Omotehara, S., Shibuya, H., Kahata, K. and Shimizu, C. 2017. Altered oscillation of Doppler-derived renal and renal interlobar venous flow velocities in hypertensive and diabetic patients. J. Med. Ultrason. (2001). 44, 305–314. Lefebvre, H. 2011. Renal function testing. In Nephrology and urology of small animals. 1st Eds., Bartges, J. and Polzin, D.J. Oxford, UK: Wiley‐Blackwell, pp: 91–98. Liu, J., Cao, T.S., Yuan, L.J., Duan, Y.Y. and Yang, Y.L. 2006. Comparison of tricuspid inflow and superior vena caval Doppler velocities in acute simulated hypovolemia: new non-invasive indices for evaluating right ventricular preload. Cardiovasc. Ultrasound. 4, 23. Mastorakou, I., Lindsell, D.R., Piepoli, M., Adamopoulos, S. and Ledingham, J.G. 1994. Pulsatility and resistance indices in intrarenal arteries of normal adults. Abdom. Imaging. 19, 369–373. Mayer, S.A., Solomon, R.A., Fink, M.E., Lennihan, L., Stern, L., Beckford, A., Thomas, C.E. and Klebanoff, L.M. 1998. Effect of 5% albumin solution on sodium balance and blood volume after subarachnoid hemorrhage. Neurosurgery. 42, 759–67. McKenna, M., Pelligand, L., Elliott, J., Cotter, D. and Jepson, R. 2020. Relationship between serum iohexol clearance, serum SDMA concentration, and serum creatinine concentration in non-azotemic dogs. J. Vet. Intern. Med. 34, 186–194. Meier, M., Johannes Jabs, W.J., Guthmann, M., Geppert, G., Aydin, A. and Nitschke, M. 2018. Sonographic venous velocity index identifies patients with chronic kidney disease and severe diastolic dysfunction. Ultrasound Int. Open. 4, E142–E148. Morrow, K.L., Salman, M.D., Lappin, M.R. and Wrigley, R. 1996. Comparison of the resistive index to clinical parameters in dogs with renal disease. Vet. Radiology Ultrasound. 37, 193–199. Nabity, M.B., Lees, G.E., Boggess, M.M., Yerramilli, M., Obare, E., Yerramilli, M., Rakitin, A., Aguiar, J. and Relford, R. 2015. Symmetric dimethylarginine assay validation, stability, and evaluation as a marker for early detection of chronic kidney disease in dogs. J. Vet. Intern. Med. 29, 1036–1044. Nelson, N.C., Drost, W.T., Lerche, P. and Bonagura, J.D. 2010. Noninvasive estimation of central venous pressure in anesthetized dogs by measurement of hepatic venous flow velocity and abdominal venous diameter. Vet. Radiol. Ultrasound. 51, 313–323. Nijst, P., Martens, P., Dupont, M., Tang, W.H.W. and Mullens, W. 2017. Intrarenal flow alterations during transition from euvolemia to intravascular volume expansion in heart failure patients. JACC Heart Fail. 5, 672–681. Nishida, M., Uechi, M., Kono, S., Harada, K. and Fujiwara, M. 2012. Estimating glomerular filtration rate in healthy dogs using inulin without urine collection. Res. Vet. Sci. 93, 398–403. Novellas, R., Espada, Y. and Ruiz de Gopegui, R. 2007a. R. Doppler ultrasonographic estimation of renal and Ocular resistive and pulsatility indices in normal dogs and cats. Vet. Radiol. Ultrasound. 48, 69–73. Novellas, R., Ruiz de Gopegui, R. and Espada, Y. 2007b. Effects of sedation with midazolam and butorphanol on resistive and pulsatility indices in healthy dogs. Vet. Radiol. Ultrasound. 48, 276–280. Novellas, R., Ruiz de Gopegui, R. and Espada, Y. 2010. Assessment of renal vascular resistance and blood pressure in dogs and cats with renal disease. Vet. Rec. 166, 618–623. Nyland, T.G., Fisher, P.E., Doverspike, M., Hornof, W.J. and Olander, H.J. 1993. Diagnosis of urinary tract obstruction in dogs using duplex Doppler ultrasonography. Vet. Radiol. Ultrasound. 34, 348–352. O’Neill, D.G., Elliott, J., Church, D.B., Mc.Greevy, P.D., Thomson, P.C. and Brodbelt, D.C. 2013. Chronic kidney disease in dogs in UK veterinary practices: prevalence, risk factors, and survival. J. Vet. Intern. Med. 27, 814–821. Ohkuma, K., Hisa, N., Futei, S., Takeda, T., Nakatsuka, S., Hisazumi, H., Narimatsu, Y. and Hiramatsu, K. 1993. Blood flow measurement of renal artery branches, in special reference to interlobular artery by color Doppler. Nihon Igaku Hoshasen Gakkai Zasshi. 53, 856–858. Ohta, Y., Fujii, K., Arima, H., Matsumura, K., Tsuchihashi, T., Tokumoto, M., Tsuruya, K, Kanai, H., Iwase, M., Hirakata, H. and Iida, M. 2005. Increased renal resistive index in atherosclerosis and diabetic nephropathy assessed by Doppler sonography. J. Hypertens. 23, 1905–1911. Ohuchi, H., Ikado, H., Noritake, K. Miyazaki, A., Yasuda, K. and Yamada, O. 2013. Impact of central venous pressure on cardiorenal interactions in adult patients with congenital heart disease after biventricular repair. Congenit. Heart Dis. 8, 103–110. Oktar, S.O., Yücel, C., Ozdemir, H. and Karaosmanoglu, D. 2004. Doppler sonography of renal obstruction: value of venousimpedance index measurements. J. Ultrasound Med. 23, 929–936. Parolini, C., Noce, A., Staffolani, E., Giarrizzo, G.F., Costanzi, S. and Splendiani, G. 2009. Renal resistive index and long-term outcome in chronic nephropathies. Radiology. 252, 888–896. Pelander, L., Häggström, J., Larsson, A., Syme, H., Elliott, J., Heiene, R. and Ljungvall, I. 2019. Comparison of the diagnostic value of symmetric dimethylarginine, cystatin C, and creatinine for detection of decreased glomerular filtration rate in dogs. J. Vet. Intern. Med. 33, 630–639. Petersen, L.J., Petersen, J.R., Talleruphuus, U., Ladefoged, S.D., Mehlsen, J. and Jensen, H.A. 1997. The pulsatility index and the resistive index in renal arteries. Associations with long-term progression in chronic renal failure. Nephrol. Dial. Transplant. 12, 1376–1380. Polzin, D.J. 2013. Evidence-based step-wise approach to managing chronic kidney disease in dogs and cats. J. Vet. Emerg. Crit. Care (San Antonio). 23, 205–215. Pouchelon, J.L., Atkins, C.E., Bussadori, C., Oyama, M.A, Vaden, S.L., Bonagura, J.D., Chetboul, V., Cowgill, L.D., Elliot, J., Francey, T., Grauer, GF., Fuentes, V.L., Moise, N.S., Polzin, DJ., Van Dongen, A.M. and Van Israël, N. 2015. Cardiovascular-renal axis disorders in the domestic dog and cat: a veterinary consensus statement. J. Small Anim. Pract. 56, 537–552. Puzzovivo, A., Monitillo, F., Guida, P., Leone, M., Rizzo, C., Grande, D., Ciccone, M.M, and Iacoviello, M. 2018. Renal venous pattern: a new parameter for predicting prognosis in heart failure outpatients. J. Cardiovasc. Dev. Dis. 5, 52. Radermacher, J., Chavan, A., Bleck, J., Vitzthum, A., Stoess, B., Gebel, M.J., Galanski, M., Koch, K.M. and Haller, H. 2001. Use of Doppler ultrasonography to predict the outcome of therapy for renal-artery stenosis. N. Engl. J. Med. 344, 410–417. Rivers, B.J., Walter, P.A., Polzin, D.J. and King, V.L. 1997. Duplex doppler estimation of intrarenal pourcelot resistive index in dogs and cats with renal disease. J. Vet. Intern. Med. 11, 250–260. Ronco, C., Haapio, M., House, A.A., Anavekar, N. and Bellomo, R. 2008. Cardiorenal syndrome. J. Am. Coll. Cardiol. 52, 1527–1539. Stepien, R.L. and Rapoport, G.S. 1999. Clinical comparison of three methods to measure blood pressure in nonsedated dogs. J. Am. Vet. Med. Assoc. 215, 1623–1628. Sugiura, T. and Wada, A. 2009. Resistive index predicts renal prognosis in chronic kidney disease. Nephrol. Dial. Transplant. 24, 2780–2785. Szatmári, V., Sótonyi, P. and Vörös, K. 2001. Normal duplex Doppler waveforms of major abdominal blood vessels in dogs: a review. Vet. Radiol. Ultrasound. 42, 93–107. Tatematsu, S., Wakino, S., Kanda, T., Homma, K., Yoshioka, K., Hasegawa, K., Sugano, N., Kimoto, M., Saruta, T. and Hayashi, K. 2007. Role of nitric oxide-producing and degrading pathways in coronary endothelial dysfunction in chronic kidney disease. J. Am. Soc. Nephrol. 18, 741–749. Tipisca, V., Murino, C., Cortese, L., Mennonna, G., Auletta, L., Vulpe, V. and Meomartino, L. 2016. Resistive index for kidney evaluation in normal and diseased cats. J. Feline Med. Surg. 18, 471–475. Vigna, C., Perna, G.P., Pacilli, M.A., De Rito V, Russo A, Salvatori MP, Lanna P, Langialonga T, Fanelli R. and Loperfido F. 1996. Doppler flow-velocity analysis of the renal arteries in left ventricular dysfunction. G. Ital. Cardiol. 26, 639–646. Zatelli, A., Roura, X., D’Ippolito, P., Berlanda, M. and Zini, E. 2016. The effect of renal diet in association with enalapril or benazepril on proteinuria in dogs with proteinuric chronic kidney disease. Open Vet. J. 6, 121–127. | ||
| How to Cite this Article |
| Pubmed Style Ito T, Hanazono K, Miyoshi K, Endoh D. Evaluation of renal function in dogs using pulsed Doppler ultrasonography. Open Vet. J.. 2024; 14(12): 3449-3459. doi:10.5455/OVJ.2024.v14.i12.29 Web Style Ito T, Hanazono K, Miyoshi K, Endoh D. Evaluation of renal function in dogs using pulsed Doppler ultrasonography. https://www.openveterinaryjournal.com/?mno=196943 [Access: June 22, 2026]. doi:10.5455/OVJ.2024.v14.i12.29 AMA (American Medical Association) Style Ito T, Hanazono K, Miyoshi K, Endoh D. Evaluation of renal function in dogs using pulsed Doppler ultrasonography. Open Vet. J.. 2024; 14(12): 3449-3459. doi:10.5455/OVJ.2024.v14.i12.29 Vancouver/ICMJE Style Ito T, Hanazono K, Miyoshi K, Endoh D. Evaluation of renal function in dogs using pulsed Doppler ultrasonography. Open Vet. J.. (2024), [cited June 22, 2026]; 14(12): 3449-3459. doi:10.5455/OVJ.2024.v14.i12.29 Harvard Style Ito, T., Hanazono, . K., Miyoshi, . K. & Endoh, . D. (2024) Evaluation of renal function in dogs using pulsed Doppler ultrasonography. Open Vet. J., 14 (12), 3449-3459. doi:10.5455/OVJ.2024.v14.i12.29 Turabian Style Ito, Takami, Kiwamu Hanazono, Kenjirou Miyoshi, and Daiji Endoh. 2024. Evaluation of renal function in dogs using pulsed Doppler ultrasonography. Open Veterinary Journal, 14 (12), 3449-3459. doi:10.5455/OVJ.2024.v14.i12.29 Chicago Style Ito, Takami, Kiwamu Hanazono, Kenjirou Miyoshi, and Daiji Endoh. "Evaluation of renal function in dogs using pulsed Doppler ultrasonography." Open Veterinary Journal 14 (2024), 3449-3459. doi:10.5455/OVJ.2024.v14.i12.29 MLA (The Modern Language Association) Style Ito, Takami, Kiwamu Hanazono, Kenjirou Miyoshi, and Daiji Endoh. "Evaluation of renal function in dogs using pulsed Doppler ultrasonography." Open Veterinary Journal 14.12 (2024), 3449-3459. Print. doi:10.5455/OVJ.2024.v14.i12.29 APA (American Psychological Association) Style Ito, T., Hanazono, . K., Miyoshi, . K. & Endoh, . D. (2024) Evaluation of renal function in dogs using pulsed Doppler ultrasonography. Open Veterinary Journal, 14 (12), 3449-3459. doi:10.5455/OVJ.2024.v14.i12.29 |

