


| Research Article | ||
Open Vet. J.. 2026; 16(1): 550-559 Open Veterinary Journal, (2026), Vol. 16(1): 550-559 Research Article Black oncom’s potential role in maintaining growth rate and vitamin B6 status of vitamin B6 deficiency model ratsAzizah Rohimah1, Budi Setiawan2*, Ahmad Sulaeman2, Eny Palupi2, Ekowati Handharyani3, Nhadira Nhestricia4 and Zaldy Rusli41Department of Nutrition, Faculty of Medicine, Universitas Indonesia, Jakarta, Indonesia 2Department of Community Nutrition, Faculty of Human Ecology, IPB University, Bogor, Indonesia 3Division of Pathology, School of Veterinary Medicine and Biomedical Sciences, IPB University, Bogor, Indonesia 4Department of Pharmacy, Faculty of Mathematics and Natural Science, Universitas Pakuan, Bogor, Indonesia *Corresponding Author: Budi Setiawan. Department of Community Nutrition, Faculty of Human Ecology, IPB University, Bogor, Indonesia. Email: bsetiawan [at] apps.ipb.ac.id/bsetiawan.ipb [at] gmail.com Submitted: 17/07/2025 Revised: 15/11/2025 Accepted: 02/12/2025 Published: 31/01/2026 © 2025 Open Veterinary Journal
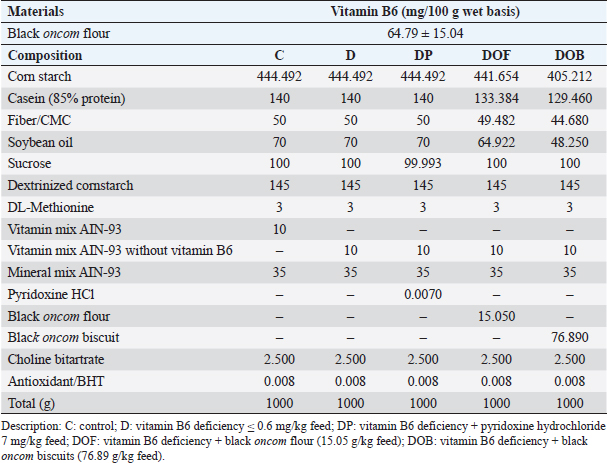
AbstractBackground: Black oncom biscuit contains contains vitamin B6 and that is a derivative product of black oncom (peanut meal fermented by Rhizopus oligosporus). Aim: This study analyzed the effect of black oncom subtitution (black oncom flour and black oncom biscuit) on body weight (BW), feed intake, growth rate, and vitamin B6 status in rats with vitamin B6 deficiency. Methods: Male rats were randomly selected into five groups and it respectively received five treatments which contained 3 g/kg feed of methionine, i.e., normal diet as control (C group), vitamin B6 deficient (≤ 0.6 mg/kg) diet (D group), vitamin B6 deficient (≤ 0.6 mg/kg) diet with pyridoxine HCl (7 mg/kg) substitution (DP), vitamin B6 deficient (≤ 0.6 mg/kg) diet with 15.05 g/kg feed of black oncom flour substitution (DOF), and vitamin B6 deficient (≤ 0.6 mg/kg) diet with 76.89 g/kg feed of black oncom biscuit substitution (DOB) for 7 weeks. Results: The BW, feed intake, and growth rate of the DOF and DOB groups were not different from those of the C group, whereas the D and feed intake were significantly reduced in the D group compared to the C group. Plasma pyridoxal 5’ phosphate levels were decreased in the D group, and increased in the DOF and DOB groups (p > 0.05). Plasma homocysteine was increased in the D and DOF groups, but decreased in the DOB group (p > 0.05). Conclusion: This study demonstrated the potential benefits of black oncom in maintaining BW, growth rate, and vitamin B6 status. Keywords: Black oncom biscuit, Black oncom flour, Body weight, Fermented peanut meal, Methionine, Vitamin B6 status. IntroductionVitamin B6 deficiency is a micronutrient deficiency problem that can be characterized by low vitamin B6 intake and low plasma levels of pyridoxal 5’ phosphate (PLP) in the blood < 30 nmol/l (suboptimal) or <20 nmol/l for severe deficiency (Tang et al., 2018). This condition still occurs in many countries, where the prevalence of vitamin B6 deficiency in adults reaches 10% (severe deficiency) and 17% (marginal deficiency), and as high as 37% in the elderly (Jungert and Neuhäuser-Berthold, 2020). Data from Indonesia shows that 58%–67% of Indonesians consume vitamin B6 foods below the recommended nutritional adequacy (Humayrah et al., 2019). Vitamin B6 deficiency can be caused by insufficient vitamin B6 intake, an unbalanced diet, not consuming supplements, or excessive supplement consumption, or metabolic disorders (Tang et al., 2018). Factors that can increase the risk of vitamin B6 deficiency include the elderly, use of drugs, alcohol consumption, and smoking (Jungert and Neuhäuser-Berthold, 2020). Comorbid conditions, such as type 2 diabetes, kidney transplantation, hemodialysis, inflammation, cancer, colorectal cancer, rheumatoid arthritis, and cardiovascular disease, can also increase the risk of vitamin B6 deficiency (Tang et al., 2018). The symptoms of vitamin B6 deficiency include weakness, difficulty sleeping, depression, dermatitis, cheilosis, glossitis, and stomatitis (Abosamak and Gupta, 2020). Vitamin B6 status can be directly determined by measuring PLP in the blood plasma (Ueland et al., 2015). PLP is the active form of vitamin B6 in the body and is used as a cofactor for various metabolic processes, such as carbohydrates, lipids, and proteins (Dalto and Matte, 2017). This disorder can reduce energy production and disrupt the growth process (Raposo-Blouw and S, 2015). Low PLP levels can trigger an increase in homocysteine (Hcy) levels in the blood, which is known as hyperhomocysteinemia (Kitagawa et al., 2015; Kitagawa et al., 2017). Increased Hcy levels can induce the pathogenesis of various diseases (Moretti and Caruso, 2019). This is supported by a prospective cohort study conducted by Zhao et al. (2018), in which a state of vitamin B6 deficiency in the long term can affect the development of various chronic diseases, including death (mortality). Vitamin B6 is present in many foods, both animal and plant foods. Vitamin B6 is mainly found in animal foods in the form of pyridoxal and pyridoxamine, whereas it is generally found in the form of pyridoxine in plant foods. Plant foods have lower bioavailability than animal foods because they contain dietary fiber components (EFSA NDA, 2016). Therefore, supplementation may protect against vitamin B6 deficiency. Several studies have shown the effect of vitamin B6 supplementation in maintaining vitamin B6 status, such as folic acid (Bajic et al., 2022), phosphatidyl choline (Kitagawa et al., 2015), choline, and betaine (Kitagawa et al., 2017). Vitamin B6 intake from food has a significant impact on vitamin B6 status (Mayengbam et al., 2016; Mayengbam et al., 2015). Vitamin B6 can be obtained from animal or plant foods. Previous studies have shown that fermented peanut meal by Rhizopus oligosporus (also known as black oncom) in West Java is a plant food with a vitamin B6 content of 2.32 mg/100 g bb (Rohimah, 2020). Black oncom biscuits (DOBs) have a vitamin B6 content of 13.09 mg/100 g (Rohimah et al., 2021a). Several studies have shown that fermented peanut meal has benefits in supporting growth, cognitive (Jiang et al., 2019), and hypolipidemic effects (Lu et al., 2021). Based on the potential benefits of fermented peanut meal, no research has examined the potential benefits of vitamin B6 content from black oncom on body weight (BW) and vitamin B6 status. Therefore, this study aimed to provide basic scientific evidence on the effects of black oncom and its processed products, that is black oncom flour and black oncom biscuits, on growth and vitamin B6 status (plasma PLP and Hcy) in experimental rats fed a vitamin B6-deficient diet. Materials and MethodsThis research began with the making of black oncom, black oncom flour, black oncom biscuits, rat feed, tested feed to rats as an animal model, and vitamin B6 status measurement. This research was conducted from November 2021 to July 2022 at the Food Development Laboratory (Department of Community Nutrition, IPB University), the Sensory Analysis Laboratory of PAU (IPB University), the experimental animal cage unit of the Biopharmaceutical Study Center, Biofarmaka (LPPM, IPB University), and the Pharmaceutical Research Laboratory of Pakuan University. The rat feed was then tested on experimental rats, followed by the analysis of vitamin B6 status (PLP and Hcy). The plasma analysis method consisted of blood sample preparation and analysis using high-performance liquid chromatography (HPLC) equipped with the Jasco software. Black oncom and diet materials, chemicals, and reagentsBlack oncom preparation refers to black oncom production from a previous study (Rohimah et al., 2021c), and black oncom flour and biscuit were produced based on previous studies (Rohimah et al., 2021b; Rohimah et al., 2021a). The diet ingredients were casein, mineral mix AIN-93M (MP Biomedicals, Santa Ana, CA), vitamin mix AIN-93 and vitamin mix AIN-93 without pyridoxine (Dyets Inc., Bethlehem, PA), corn starch (Zhucheng Xingmao Corn Developing Company Ltd., Zhucheng, China), CMC (Chongqing Lihong Fine Chemicals Company Ltd., Nan’an District, Chongqing, China), maltodextrin (Zhucheng Dongxiao Biotechnology Company Ltd., Zhucheng, Weifang, China), soybean oil (Welhar Mulia Jaya, Welhar, Indonesia), choline bitartrate and pyridoxine hydrochloride were purchased from Sigma Aldrich (St. Louis, MO, USA), DL methionine (Evonik Industries, Essen, Germany), and antioxidants (Nutriad International NV, Chester, UK). Hcy (purity ≥ 98%), PLP, chlorogenic acid internal standard, and trimethylamine (TEA) were obtained from Sigma Aldrich Company (St. Louis, MO, USA). Heptane-1-sulfonic acid sodium salt, water, and organic solvents (methanol, acetonitrile) were obtained from Merck (Darmstadt, Germany), while ortho-phosphoric acid 85% was obtained from Emsure, Merck. Chemicals and reagents used were included in the analytical standards. Experimental animalsThirty male Sprague-Dawley old rats 8–9 weeks with an average BW of 200 g were obtained from a certified experimental animal laboratory (BPOM). The rats were housed in an experimental animal cage unit at Biofarmaka LPPM, IPB University. The rats were housed in polypropylene box cages (p=35 cm, l=27 cm, t=13 cm) in pairs at a room temperature of 24°C–25°C and humidity of 60%–70%, with alternating dark:light cycles (12:12 h). The rats were acclimatized for 14 days before the intervention using normal AIN-93M feed with 3 g/kg methionine feed. Before the intervention, blood was collected from the rats through the lateral tail vein using a heparinized syringe to measure plasma PLP and Hcy levels. The rats were then randomly divided into five groups: C : control group; D : vitamin B6 deficiency model group (≤ 0.6 mg/kg feed); DP : vitamin B6 deficiency group + pyridoxine HCl (7 mg/kg feed); DOF : vitamin B6 deficiency group + black oncom flour (15.05 g/kg feed); DOB : vitamin B6 deficiency group + black oncom biscuits (76.89 g/kg feed). The rat diet used in this study was divided into five groups, as described by Reeves et al. (1993), with slight modifications (Table 1). Substitution with black oncom flour and black oncom biscuits considering the vitamin B6 requirement per kg feed (7 mg/kg feed). The intervention was conducted for 7 weeks (Suidasari et al., 2016; Kumrungsee et al., 2019). Exclusion criteria of this study were rats with congenital disorder or dead. Accordingly, the total number of rats that matched to inclusion criteria for data analysis were 5 for C group, 6 for D group, 3 for DP group, 6 for DOF group, 4 for DOB group. Nevertheless, the total sample of each group still fulfilled the minimum standards for statistical analysis based on the sample size calculation (3 samples of each group) of Arifin and Zahiruddin (2017). The rats were fasted overnight and anesthetized with ketamine and xylazine at the end of the study. Blood was collected from rats by cardiac puncture using a heparinized syringe to obtain plasma. The syringe containing blood was centrifuged at 500 × g for 10 minutes. Plasma was stored at ˗20°C until analysis. Table 1. Composition of vitamin B6 in the black oncom flour (mg/100 g wet basis) and intervention diet (g/kg feed).
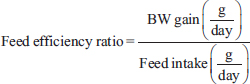
Measurements of body weight, growth rate, feed intake, and feed efficiencyBody weight (BW) measurements were conducted once a week, and the growth rate was measured by comparing BW each week to the initial BW in percentage. Feed intake was measured daily using a scale by weighing the initial conditions and after utilization. The feed efficiency ratio was calculated using comparative data on BW and feed intake.
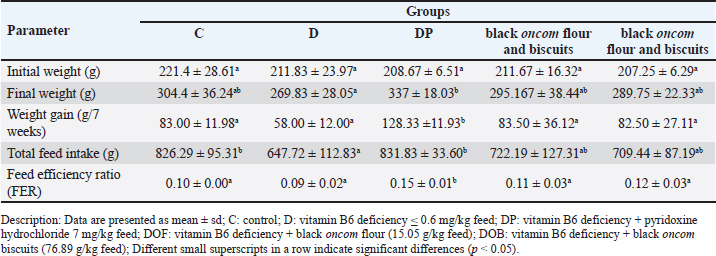
Analysis of vitamin B6 status (plasma PLP and Hcy levels)Sample preparationThe sample preparation procedure was based on a previously reported method (Al-Tannak et al., 2022). Briefly, 40 µl of plasma was placed into an Eppendorf tube. Next, 200 µl of acetonitrile was added to the deproteinization process. The mixture was vortexed for 10 seconds and centrifuged at 4,000 rpm for 15 minutes. Centrifuged samples were separated from the supernatant. A total of 100 µl of the eluate was added to 100 µl of the internal standard solution and diluted with 300 µl of HPLC-grade water. The sample was filtered using a 0.22 µm sterile nylon syringe filter (Membrane solution, Auburn, Alabama, USA), and a 10 µl sample was injected into the HPLC column. Solution and standard preparationStock solutions of PLP, Hcy, and the internal standard chlorogenic acid (IS) were prepared from 1 mg of PLP, Hcy, and IS standards respectively dissolved in 10 ml of HPLC grade water. The concentration of each standard (PLP, Hcy, and IS) was 100 ppm. The solutions were stored at 4°C in amber bottles covered with aluminum foil (Gandhi et al., 2024; Mateeva et al., 2023; Cabo et al., 2014). Stock solutions were used to prepare daily, freshly prepared standard series solutions. Instrumentation and chromatography conditions HPLC (Jasco LC-4000) was used. The analytes were eluted using two mobile phases. Mobile phase A contained 0.05 mM heptane 1-sulfonic acid sodium salt containing 0.05% TEA (pH 2.3, adjusted with orthophosphoric acid), whereas mobile phase B contained 100% methanol. The elution of the mobile phase was set at 67:33 (mobile phase A:B), with a flow rate of 0.5 ml/min. The composition of the mobile phase and the flow rate were as described previously (Gandhi et al., 2024). Analytes were separated using a C18 Inertsil ODS-3 column (particle size 5 µm, 4.6 × 150 mm) (C/N. 5050-01731, S/N. 1A5181171) from GL Science, Inc. (Tokyo, Japan), and the column temperature was maintained at 25°C. The injection volume of 10 µl was introduced into the sampler using a removable needle syringe (Hamilton Company, Nevada, USA), with a total running time of 11.5 minutes. All analysis processes were controlled using the Jasco software. Hcy and PLP levels were simultaneously determined and monitored using a Photodiode Array detector at a wavelength of 200–400 nm and a UV detector at a wavelength of 210 nm. The levels of Hcy and PLP were determined using a standard calibration curve. Validation of the vitamin B6 status analysisThe analysis of vitamin B6 status was validated using the standard addition method in three varied concentrations of Hcy, PLP, and chlorogenic acid internal standard (Shaik and Gan, 2013). The validation method included precision (% RSD), % recovery, and limit of detection (LOD) determined from intra-day analysis (n=2) according to the Guidelines for Standard Method Performance Requirements (AOAC International, 2016). Statistical analysisData are presented as the mean ± SD. Data on BW, feed intake, and feed efficiency ratio were analyzed using ANOVA with SPSS version 16.0. Plasma PLP and Hcy levels paired t-test results before and after the intervention. The test value was considered significant if the p-value was less than 0.05. If a significant difference was found, Duncan’s test was performed. Ethical approvalThe Animal Ethics Commission of the Faculty of Veterinary Medicine, IPB University, approved this study (number 040/KEH / SKE/XI / 2021). Each process complied with the Animal Care and Use Recommendations. ResultsBW, feed intake, feed efficiency, and growth rate of ratsBW characteristics were presented in the form of initial weight and final weight (Table 2). All groups had the same initial weight before the intervention, which was not significantly different (p > 0.05). At the end of the intervention (week 7), the weight of the DP group was not different from that of the C, black oncom flour and biscuitsgroups (p > 0.05). Group D had a lower weight gain than the other groups. However, the value was not significantly different (p > 0.05) between the C, black oncom flour and biscuits groups but was significantly different from the DP group (p < 0.05). The higher weight gain in the DP group might be due to the single pyridoxine supplementation. The characteristics of weight showed that a vitamin B6-deficient diet did not significantly affect weight in the 7-week intervention. Moreover, black oncom substitution in the form of flour and biscuits had no significant difference in weight gain, but it had a potential role in maintaining BW because the BW of the groups was not significantly different from the normal and pyridoxine-substituted groups. Table 2. BW, feed intake, and feed efficiency in vitamin B6 deficiency model rats were substituted with black oncom for 7 weeks.
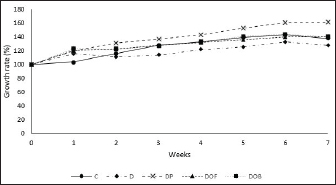
The BW of the rats was in line with the total feed intake (Table 2). The D group had a lower total feed intake (p < 0.05) than the C and DP groups. However, the DP group had no difference in feed intake from the C group, but had a significantly higher BW gain (p < 0.05). Meanwhile, the feed intake of the black oncom flour and biscuits groups did not differ from those of the C group. Based on feed intake and weight gain, the FER for each treatment was determined. The FER of the D group was lower (p > 0.05) than that of the C group, whereas the FER of the black oncom flour and biscuits groups were not different from those of the C, black oncom flour and biscuits groups. The FER data indicate that the D group was unable to convert diet to BW effectively. The black oncom-substituted groups had the potential ability to convert diet to BW because they tended to have higher FER than the D group. These findings show that substituting black oncom flour and biscuits can maintain BW in rats with vitamin B6 deficiency. Meanwhile, the D group can still experience weight gain by using limited amounts of dietary vitamin B6 (Mayengbam et al., 2015; Suidasari et al., 2016). BW measurement at the beginning and every week of the study can determine the growth rate of rats, as shown in Figure 2. The initial growth rate of the rats at the starting point was not significantly different (p > 0.05). Furthermore, there was no significant difference in the growth rate (p=0.10). The DP group had a growth rate that was different from that of the C group, whereas the black oncom flour and biscuits groups had growth rates that were not significantly different (p > 0.05). Group D had a lower growth rate than the other groups. However, the value was not significantly different (p > 0.05) from those of the C, black oncom flour and biscuits groups but was significantly different from that of the DP group (p < 0.05). The higher growth rate in the DP group might be due to the type of vitamin B6 structure, as the active form. Overall, most treatment groups tended to experience a growth rate gain every week until the end of the intervention, except for the C and D groups. The C group experienced a decrease in growth rate in the last intervention. The factor that might have caused it was an uncontrolled environment, such as cold weather. Meanwhile, the growth rate of the D group fluctuated, experiencing a decline in growth rate in the second week, an increased in the 4th– 6th weeks, and in the last weeks. The D group could not maintain a growth rate due to limited intake of vitamin B6 in the diet. However, the D group can still experience growth rates by utilizing limited amounts of vitamin B6 (Mayengbam et al., 2015; Suidasari et al., 2016). These findings show that the substitution of black oncom flour and biscuits in rats fed a vitamin B6-deficient diet played a potential role in maintaining the growth rate.
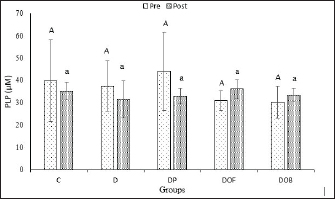
Fig. 2. Effect of black oncom substitution on the growth rate (%) of rats fed a vitamin B6-deficient diet for 7 weeks. Description: C: control; D: vitamin B6 deficiency ≤0.6 mg/kg feed; DP: vitamin B6 deficiency + pyridoxine hydrochloride 7 mg/kg feed; DOF: vitamin B6 deficiency + black oncom flour (15.05 g/kg feed); DOB: vitamin B6 deficiency + black oncom biscuits (76.89 g/kg feed). Validation of the vitamin B6 status analysisValidation of vitamin B6 status analysis covered the precision (% RSD), % recovery, and LOD. The value of RSD was < 6% that means the validation method showed received precision (Aoac International, 2016). Moreover, the accuracy of vitamin B6 status was exhibited as a percentage of recovery in the range of 88.7–107.4. It complied with the AOAC that the acceptable percentage recovery was 80–110 (AOAC International, 2016). Furthermore, the intra-day LOD of the method was 0.9 (µg/ml) for PLP and 3.6 (µg/ml) for Hcy. It showed the lowest concentration of PLP and Hcy detected by the instrument. This validation was valid, accurate, and can measure PLP and Hcy levels in the rat plasma and strengthen the analysis of vitamin B6 status. Vitamin B6 status (plasma PLP and Hcy levels)Vitamin B6 status was determined from the PLP levels in the plasma (Fig. 3). The ANOVA results showed that plasma PLP levels were not significantly different (p > 0.05) between the groups before and after 7 weeks of intervention. However, the PLP values of the C, D, and DP groups after intervention tended to be lower than those in the other groups (DOF and DOB). The paired t-test results before and after the intervention showed a fairly large decrease in the plasma PLP levels of the vitamin B6-deficient group (D) (p > 0.05), and the provision of a vitamin B6-deficient diet substituted with black oncom did not affect the plasma PLP levels (p > 0.05). Nevertheless, the PLP levels of all groups still met the normal criteria of vitamin B6 status. It indicated that a vitamin B6-deficient diet can reduce the PLP level of rats. Meanwhile, the reduction in the PLP of the control and pyridoxine-substituted diets happened because of some factors. The administration of vitamin B6 in the form of pyridoxine can increase its excretion in urine and increase vitamin B6 requirement based on body condition, but there was no further analysis of that in this study. On the other hand, DOF tends to increase the PLP level higher than DOB, which might be due to the availability of fermented peanut meal than derivative products in the form of biscuits, but this has not been covered in this study. Despite this, black oncom substitutes had the potential to increase the PLP level of rats fed a vitamin B6-deficient diet due to the vitamin B6 content of black oncom flour and black oncom biscuits.
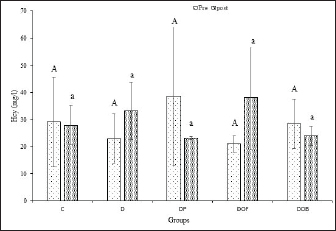
Fig. 3. Plasma PLP levels (µM) in rats with vitamin B6 deficiency who were substituted with black oncom for 7 weeks. Description: Data are presented as mean ± sd; C: control; D: vitamin B6 deficiency ≤0.6 mg/kg feed; DP: vitamin B6 deficiency + pyridoxine hydrochloride 7 mg/kg feed; DOF: vitamin B6 deficiency + black oncom flour (15.05 g/kg feed); DOB: vitamin B6 deficiency + black oncom biscuits (76.89 g/kg feed).; different capital superscripts indicate significant difference in pre-intervention condition, while different small superscripts indicate significant differences in post-intervention condition (p < 0.05). PLP level analysis in vitamin B6-deficient rats can be a reference for Hcy levels. Vitamin B6 deficiency can affect the increase of Hcy levels in the blood (hyperhomocysteinemia) before and after intervention, as shown in Figure 4. Before the intervention, Hcy levels were the same and were not significantly different (p > 0.05) in all groups. The D and DOF groups had high Hcy levels after 7 weeks of intervention, but the values were not significantly different from those of the other groups that had low Hcy levels (p > 0.05). There was a rise change in the Hcy levels of the D and DOF groups depending on the paired t-test results before and after the intervention (p > 0.05) and the reduction change of Hcy levels in the C, DP, and DOB groups (p > 0.05). However, the increase and decrease were not significantly different from those in the control group or the pyridoxine-substituted group because they were still within the normal range. Increased Hcy levels in the D groups were due to low vitamin B6 intake and low PLP concentration in the body. Substituting black oncom biscuits in a vitamin B6-deficient diet can reduce plasma Hcy levels, whereas black oncom flour increases plasma Hcy levels. The rising level of Hcy in the DOF groups might be due to the addition of methionine from the DOF, which was unbalanced with the vitamin B6 requirement.
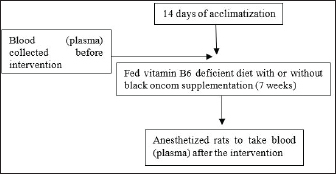
Fig. 4. Plasma Hcy levels (µg/ml) in rats with vitamin B6 deficiency who were substituted with black oncom for 7 weeks. Description: Data are presented as mean ± sd; C: control; D: vitamin B6 deficiency ≤0.6 mg/kg feed; DP: vitamin B6 deficiency + pyridoxine hydrochloride 7 mg/kg feed; DOF: vitamin B6 deficiency + black oncom flour (15.05 g/kg feed); DOB: vitamin B6 deficiency + black oncom biscuits (76.89 g/kg feed). Different capital superscripts indicate significant differences in pre-intervention conditions, whereas different small superscripts indicate significant differences in post-intervention condition (p < 0.05). DiscussionThis study examined black oncom-substitution in vitamin B6-deficient diet to determine vitamin B6 status. This study involved variables such as BW, feed intake, feed efficiency ratio, growth rate, PLP levels, and Hcy levels. This study was conducted for 7 weeks to prevent severe vitamin B6 deficiency. The study design is demonstrated in Figure 1 black oncom substitution was added in one dose depending on the vitamin B6 content of the ingredients (equal to 7 mg vitamin B6/kg feed), especially 15.05 g/kg feed of black oncom flour and 76.89 g/kg feed of black oncom biscuits.
Fig. 1. Design of the animal experiment. This study showed that substituting black oncom flour and black oncom biscuits to rats fed a vitamin B6-deficient diet exhibited maintaining BW because they can maintain feed intake and use it for weight gain (feed efficiency). Furthermore, this study revealed a stable growth rate trend in the DP, DOF, and DOB groups compared with the groups that did not receive black oncom or pyridoxine (D group). In contrast, the D group experienced a fluctuating trend in the growth rate, low feed intake, low BW, and low feed efficiency. This is because vitamin B6 deficiency normally causes decreased BW, feed intake, and feed efficiency in animals (Mayengbam et al., 2015; Mayengbam et al., 2016). In addition, vitamin B6 is limited as a cofactor in glycogen phosphorylase in the liver and muscle, which catalyzes glycogen conversion to glucose-1 phosphate. This interference might decrease blood glucose levels by inhibiting glycogen phosphorylase; therefore, the body lacks energy for growth, which causes growth disorders (Qian et al., 2017; Toriumi et al., 2021). The findings of this study indicated that vitamin B6 of black oncom may support the glycogen phosphorylase process for energy production, so that rat can maintain BW and growth rate. This study is in line with a previous study that added fermented peanut meal can maintain the balance of serum leptin levels, thereby maintaining appetite and rat weight by controlling hunger and satiety signals (Lu et al., 2021). The peptide is another component that may play a role in maintaining weight. Previous research exhibited polypeptide of fermented peanut meal can maintain BW through leptin reduction to suppress excessive appetite (Ding et al., 2023). Meanwhile, the high increase in BW and feed efficiency in the DP group occurred because of the influence of the purity of the vitamin B6 used as the active form, that is, pyridoxine HCl, where the provision of pyridoxine HCl substitution can support the growth performance of rats (Suidasari et al., 2016). Substituting black oncom in vitamin B6-deficient diet affects vitamin B6 status, including PLP and Hcy levels. Vitamin B6 status analysis was validated by the addition standard method that is suitable for measuring Hcy and PLP in the plasma of rats. The precision data presented in the validation measurement met the AOAC requirement standard by as much as 7.3%, which showed consistent results. Moreover, the accuracy data of percent recovery indicated appropriate measurement to determine PLP and Hcy because percent recovery in the range of 80–110 conformance to AOAC requirement standard. Furthermore, the LOD determined the PLP and Hcy components in the lowest concentration. Thus, the analysis of vitamin B6 status in this study has good precision, accuracy, and LOD, which are in accordance with the AOAC’s guideline for standard method performance requirements (AOAC International, 2016). Therefore, this validation method, especially the addition standard method, gave valid and reliable results for measuring PLP and Hcy in the plasma of rats, but it was not suitable for other samples. This study revealed that a vitamin B6-deficient diet can reduce plasma PLP levels in the blood. Low vitamin B6 intake causes a decrease in PLP formation, thereby reducing plasma PLP levels in the blood. The decrease in plasma PLP levels reflects tissue retention of enzymes that require PLP. This is in agreement with the results of previous studies in which PLP levels decreased due to a vitamin B6-deficient diet because the body does not receive sufficient vitamin B6 intake, so there is a decrease in PLP formation or a decrease in PLP reserves both in plasma and body organs (Kitagawa et al., 2015; Mayengbam et al., 2015; Taysi et al., 2015; Kitagawa et al., 2017). The main finding of this study is that substitution with black oncom flour and biscuits in a vitamin B6-deficient diet showed the potential to prevent a decrease in plasma PLP. The prevention of a decrease in plasma PLP is thought to be supported by the additional intake of vitamin B6 from black oncom flour (64.79 mg/100 g) and black oncom biscuits (13.09 mg/100) (Rohimah et al., 2021a). The bioavailability of black oncom flour and black oncom biscuits might be different and affect the rat PLP levels. Black oncom biscuit production is a derivative product that has gone through a cooking process, so the PLP level tends to be lower than that of black oncom flour substitution. This agrees with Combs’s (2012) finding that processed food can influence bioavailability. Vitamin B6 from plant foods in the form of pyridoxine can influence the process of forming the active form of vitamin B6, i.e., PLP, through the kinase enzyme rephosphorylation. In the blood, PLP is bound to albumin or serum, so PLP measurements in plasma can reflect vitamin B6 intake and the body’s vitamin B6 status (Ueland et al., 2015). Vitamin B6 intake is the strongest determinant of vitamin B6 status. Although vitamin B6 is consumed from food sources, adequate intake of vitamin B6 from food does not pose a risk of vitamin B6 deficiency (Schorgg et al., 2021). Restricting vitamin B6 intake can disrupt methionine metabolism by increasing Hcy levels. The active form of vitamin B6, PLP, plays a role in the processes of transamination, transsulfuration, and protein decarboxylation (Parra et al., 2018). PLP is a cofactor for the cystathionine beta synthase (CBS) enzyme that converts Hcy to cystathionine and a cofactor for the CGS enzyme that converts cystathionine to cysteine (Azzini et al., 2020). Low levels of PLP can disrupt these enzymes so that Hcy cannot be metabolized into cysteine, which increases the body’s v levels (Moretti and Caruso, 2019). The results of this study are in agreement with those of previous studies in which the provision of a vitamin B-deficient diet increased Hcy levels (Nieraad et al., 2021). In cases of moderate vitamin B6 deficiency, plasma Hcy levels that are not different from those in the C or DP groups are normal (Hsu et al., 2015; Mayengbam et al., 2015). This indicated that a marginal deficiency was achieved, and sufficient vitamin B6 activity was still present for Hcy metabolism (Raposo-Blouw, 2015). Although there was no disturbance in Hcy levels, disturbances may occur in hepatic enzymes that process Hcy metabolism, such as CBS and cystathionine gamma lyase, or enzymes that require PLP as a cofactor. This study is the first to show different effects of black oncom flour and black oncom biscuit on Hcy levels. Black oncom biscuit may manage methionine metabolism due to the balance of methionine and vitamin B6 or other nutrient components in the product. Nuts and cereals complement the amino acid components of methionine and lysine (Han et al., 2021). The methionine of biscuit can be metabolized by rats that were supported by vitamin B6 action in remethylation and transsulfuration metabolism. Meanwhile, the provision of black oncom flour cannot reduce Hcy levels, allegedly because of the uncertainty of the potential action of the SAH hydrolase enzyme during the fractionation process of SAH into adenosine and Hcy (Hsu et al., 2015). Hcy levels in the body are determined by protein intake (methionine) and vitamin status (B6, B12, and folate) (Moretti and Caruso, 2019). Methionine is an essential amino acid that contains sulfur and is a precursor for the formation of Hcy, cysteine, creatine, and carnitine (Martínez et al., 2017). Fermented peanut meal products, such as black oncom flour and black oncom biscuits are also thought to contain methionine. Fermented peanut meal has a higher methionine content than unfermented peanut meal, and the fermentation process can increase methionine to 95% (Li et al., 2023; Yang et al., 2016). High methionine intake from food in vitamin B6 deficiency triggers hyperhomocysteinemia due to Hcy metabolism disorder, especially in the transsulfuration and remethylation pathway. Transsulfuration metabolism disorder causes the conversion of Hcy to cystathionine and the conversion of cystathionine to cysteine to be inhibited due to the disruption of enzymes that are supported by vitamin B6. If the vitamin B6 concentration is low, the body tends to convert Hcy to SAH rather than undergoing the remethylation process of Hcy into methionine (Zhao et al., 2024). ConclusionIn summary, a vitamin B6-deficient diet can decrease feed intake, which causes low BW; thus, this condition can decrease feed efficiency and growth rate. Black oncom in the form of flour or biscuits tends to maintain the BW, feed efficiency, and growth rate. According to the vitamin B6 status, black oncom has a potential role in maintaining PLP levels, which indicates increased PLP levels during black oncom substitution in a vitamin B6-deficient diet. In addition, substitution with black oncom flour and biscuits can maintain Hcy levels. However, the methionine content of black oncom flour and biscuits should be considered. This study had a limitation in the sample size of data analysis, so that it should be increased in the future study, especially to maximize sample analysis of data analysis to improve the result. Furthermore, it is necessary to measure other parameters, such as the bioavailability of vitamin B6 in black oncom, how much PLP can be utilized (absorption, distribution, and excretion), or measurements of enzymes that require PLP levels to comprehensively examine whether there is a metabolic diversion of methionine. AcknowledgmentsWe wish to acknowledge The Sensory Analysis Laboratory of PAU, IPB University, Bogor, Indonesia, for providing the making feed, the staff of the experimental animal cage unit of the Biopharmaceutical Study Center, Biofarmaka LPPM, IPB University, for their help in handling the animal model, and Helen Ruth, who helped in analyzing PLP and Hcy using HPLC at the Pharmaceutical Research Laboratory of Pakuan University, Bogor, Indonesia. Conflict of interestAll authors declare no conflicts of interest. FundingThis research was funded by the Directorate of Higher Education, the Ministry of Education and Culture, and the Ministry of Research, Technology of the Republic of Indonesia (No: 2110/IT3.L1/PN/2021 and No: 1/E1/KP.PTNBH/2021) to Budi Setiawan. Author contributionAR: conceptualization, design of the method and research, writing of the original draft, revising of the reviewed draft, and editing of the final draft. BS: supervision, design method, original draft writing, review, and editing. AS: supervision, designed method, writing original draft, writing, review, and editing. EP: supervision, designed method, writing original draft, writing, review, and editing. EH: supervision, designed method of animal experiment, writing original draft, writing, review, and editing. NN: designed, guided, and validated PLP and Hcy analysis, writing, review, and editing. ZR: designed, guided, and validated PLP and Hcy analysis, writing, review, and editing. All authors have read and approved the final version of the manuscript. Data availabilityAll data of the findings of this research are included in the manuscript ReferencesAbosamak, N. R. and Gupta V. 2020. Vitamin B6(Pyridoxine). Treasure Island, FL: StatPearls Publishing. Arifin, W.N. and Zahiruddin, W.M. 2017. Sample size calculation in animal studies using resource equation approach. Malaysian J. Med. Sci. 24(5), 101–105; doi: 10.21315/mjms2017.24.5.11 Al-Tannak, N.F., Al-Shatti, B.J., Al Ali, A.S. and Hemdan, A. 2022. Quality by design approach for a multicomponent quantification Using HPLC-PDA and HPLC-MS: application to dosage form and biological body fluids. Separations 9(8), 1–14; doi:10.3390/separations9080217 AOAC International. 2016. Guidelines for standard method performance requirements. AOAC. pp: 1–18. Azzini, E., Ruggeri, S. and Polito, A. 2020. Homocysteine: its possible emerging role in at-risk population groups. Int. J. Mol. Sci. 21, 1–27; doi:10.3390/ijms21041421 Bajic, Z., Sobot, T., Skrbic, R., Stojiljkovic, M.P., Ponorac, N., Matavulj, A. and Djuric, D.M. 2022. Homocysteine, vitamins B6 and folic acid in experimental models of myocardial infarction and heart failure—how strong is that link?. Biomolecules 12(4), 1–27; doi:10.3390/biom12040536 Cabo, R., Kozik, K., Milanowski, M., Hernes, S., Slettan, A., Haugen, M., Ye, S., Blomhoff, R. and Mansoor, M.A. 2014. A simple high-performance liquid chromatography (HPLC) method for the measurement of pyridoxal-5-phosphate and 4-pyridoxic acid in human plasma. Clin. Chim. Acta. 433, 150–156; doi:10.1016/j.cca.2014.03.003 Combs, G.F. 2012. The Vitamins: fundamental Aspects in Nutrition and health. 3rd ed., San Diego: Elsevier Academic Press. Dalto, D. and Matte, J.J. 2017. Pyridoxine (vitamin B6) and the glutathione peroxidase system; a link between one-carbon metabolism and antioxidation. Nutrients 9(189), 189–113; doi:10.3390/nu9030189 Ding, H., Zhang, H., Lu, Y., Jiang, X., Liu, Q., Hu, Y., Sun, H. and Ma, A. 2023. Effects of the polypeptide from peanut meal mixed fermentation on lipid metabolism and intestinal flora of hyperlipidemic mice. J. Sci. Food. Agric. 103(9), 4351–4359; doi:10.1002/jsfa.12500 EFSA NDA. 2016. Dietary reference values for vitamin B6. EFSA J. 14(6), 1–91; doi:10.2903/j.efsa.2016.4485 Gandhi, V., Akil, L., Ford, S. and Khadra, I. 2024. Development and validation of HPLC method for the simultaneous determination of vitamin B1, B2, B6 and B12 in human blood plasma using hydrophilic interaction liquid chromatography (HILIC). SSRN. in press. Han, F., Moughan, P.J., Li, J., Stroebinger, N. and Pang, S. 2021. The complementarity of amino acids in cooked pulse/cereal blends and effects on DIAAS. Plants 10(10), 1–10; doi:10.3390/plants10101999 Hsu, C., Huang, S.C. and Huang, Y. 2015. Role of vitamin B6 status on antioxidant defenses, glutathione, and related enzyme activities in mice with homocysteine-induced oxidative stress. Food Nutr. 59(25702), 1–7; doi:10.3402/fnr.v59.25702 Humayrah, W., Hardinsyah, H., Tanziha, I. and Fahmida, U. 2019. Cluster analysis of food consumption patterns among women of reproductive age in Indonesia. J. Gizi. Dan. Pangan. 14(3), 117–126; doi:10.25182/jgp.2019.14.3.117-126 Jiang, X., Ding, H., Liu, Q., Wei, Y. and Zhang, Y. 2019. The effects of peanut meal extracts fermented by Bacillus natto on the growth performance, learning and memory skills and gut microbiota modulation in mice. Br. J. Nutr. 123(4), 383–393; doi:10.1017/S0007114519002988 Jungert, A. and Neuhäuser-Berthold, M. 2020. Determinants of vitamin B6 status in community-dwelling older adults: a longitudinal study over a period of 18 years. J. Gerontol. A. Biol. Sci. Med. Sci. 75(2), 374–379; doi:10.1093/gerona/glz010 Kitagawa, E., Yamamoto, T., Fujishita, M., Ota, Y., Nakagawa, T. and Hayakawa, T. 2017. Choline and betaine ameliorate liver lipid accumulation induced by vitamin B6 deficiency in rats. Biosci. Biotechnol. Biochem. 81(2), 316–322; doi:10.1080/09168451.2016.1240604 Kitagawa, E., Yamamoto, T., Yamamoto, K., Nakagawa, T. and Hayakawa, T. 2015. Accumulation of lipid in rat liver was induced by vitamin B6 deficiency and was ameliorated by supplemental phosphatidylcholine in the diet. Biosci. Biotechnol. Biochem. 79(8), 1320–1326; doi:10.1080/09168451.2015.1020755 Kumrungsee, T., Nirmagustina, D.E., Arima, T., Onishi, K., Sato, K., Kato, N. and Yanaka, N. 2019. Novel metabolic disturbances in marginal vitamin B6-deficient rat heart. J. Nutr. Biochem. 65, 26–34; doi:10.1016/j.jnutbio.2018.11.004 Li, S., Li, C., Chen, S., Wang, X., Liu, J., Deng, X., Cai, H. and Liu, G. 2023. Effects of solid-state fermentation on the standardized ileal digestibility of amino acids and apparent metabolizable energy in peanut meal fed to broiler chickens. Fermentation 9(4), 1–14; doi:10.3390/fermentation9040346 Lu, Y., Ding, H., Jiang, X., Zhang, H., Ma, A., Hu, Y. and Li, Z. 2021. Effects of the extract from peanut meal fermented with Bacillus natto and Monascus on lipid metabolism and intestinal barrier function of hyperlipidemic mice. J. Sci. Food Agric. 101(6), 2561–2569; doi:10.1002/jsfa.10884 Mateeva, A., Kondeva-Burdina, M., Peikova, L., Guncheva, S., Zlatkov, A. and Georgieva, M. 2023. Simultaneous analysis of water-soluble and fat-soluble vitamins through RP-HPLC/DAD in food supplements and brewer’s yeast. Heliyon 9(1), e12706; doi:10.1016/j.heliyon.2022.e12706 Mayengbam, S., Raposo, S., Aliani, M. and House, J.D. 2015. Oral exposure to the anti-pyridoxine compound 1-amino d-proline further perturbs homocysteine metabolism through the transsulfuration pathway in moderately vitamin B6 deficient rats. J. Nutr. Biochem. 26(3), 241–249; doi:10.1016/j.jnutbio.2014.10.014 Mayengbam, S., Raposo, S., Aliani, M. and House, J.D. 2016. A vitamin B-6 antagonist from flaxseed perturbs amino acid metabolism in moderately vitamin B-6-deficient male rats. J. Nutr. 146(1), 14–20; doi:10.3945/jn.115.219378 Martínez, Y., Li, X., Liu, G., Bin, P., Yan, W., Más, D., Valdivié, M., Hu, C.A., Ren, W. and Yin, Y. 2017. The role of methionine on metabolism, oxidative stress, and diseases. Amino Acids. 49(12), 2091–2098; doi: 10.1007/s00726-017-2494-2 Moretti, R. and Caruso, P. 2019. The controversial role of homocysteine in neurology : from labs to clinical practice. Int. J. Mol. Sci. 20(231), 1–22; doi:10.3390/ijms20010231 Nieraad, H., De Bruin, N., Arne, O., Hofmann, M.C.J., Gurke, R., Schmidt, D., Ritter, M., Parnham, M.J. and Geisslinger, G. 2021. Effects of Alzheimer-like pathology on homocysteine and homocysteic acid levels-an exploratory in vivo kinetic study. Int. J. Mol. Sci. 22(2), 1–18; doi:10.3390/ijms22020927 Parra, M., Stahl, S. and Hellmann, H. 2018. Vitamin B6 and its role in cell metabolism and physiology. Cells 7(7), 1–28; doi:10.3390/cells7070084 Qian, B., Shen, S., Zhang, J. and Jing, P. 2017. Effects of vitamin B6 deficiency on the composition and functional potential of T cell populations. J. Immunol. Res. 2017, 1. Raposo-Blouw, S. 2015. The effect of marginal pyridoxine deficiency and high protein intake on vitamin B6 status and enzymes in intermediary metabolism in rats, M.Sc. thesis, University of Manitoba, Canada. Reeves, P.G., Nielsen, F.H. and Fahey, G.C. 1993. AIN-93 Purified diets for laboratory rodents: final report of the American Institute of Nutrition Ad of the AIN-76A rodent diet. J. Nutr. 123(11), 1939–1951; doi:10.1093/jn/123.11.1939 Rohimah, A. 2020. Modifikasi proses pembuatan oncom hitam dan pemanfaatannya dalam pengembangan produk biskuit sebagai makanan tambahan lansia, M.S. thesis, IPB University, Bogor, ID. Rohimah, A., Setiawan, B., Palupi, E., Sulaeman, A. and Handharyani, E. 2021a. Comparison of peanut and black oncom biscuit: nutritional characteristics and aflatoxin evaluation with the potential health benefits. Ann. Agric. Sci. 66(1), 87–92; doi:10.1016/j.aoas.2021.06.001 Rohimah, A., Setiawan, B., Palupi, E., Sulaeman, A. and Handharyani, E. 2021b. Physical Characteristics and Nutritional Contents of Peanut Flour and Black Oncom (Fermented Peanut Meal) Flour. In the 2nd International Seminar on Promoting Local Resources for Sustainable Agriculture and Development, Atlantis Press, Bengkulu, Indonesia pp 366–372. Rohimah, A., Setiawan, B., Roosita, K. and Palupi, E. 2021c. The effects of soaking treatments and fermentation process on nutritional and aflatoxin contents of fermented peanut cake (Black oncom). Polish. J. Nat. Sci. 36(1), 59–78. Schorgg, P., Bärnighausen, T., Rohrmann, S., Cassidy, A., Karavasiloglou, N. and Kühn, T. 2021. Vitamin B6 status among vegetarians: findings from a population-based survey. Nutrients 13(5), doi:10.3390/nu13051627 Shaik, M.M. and Gan, S.H. 2013. Rapid resolution liquid chromatography method development and validation for simultaneous determination of homocysteine, vitamin B6, B9, and B12 in human serum. Indian J. Pharmacol. 45(2), 159–167. Suidasari, S., Stautemas, J., Uragami, S., Yanaka, N., Derave, W. and Kato, N. 2016. Carnosine content in skeletal muscle is dependent on vitamin B6 status in rats. Front. Nutr. 2, 1–7; doi:10.3389/fnut.2015.00039 Taysi, S., Keles, M.S., Gumustekin, K., Akyuz, M., Boyuk, A., Cikman, O. and Bakan, N. 2015. Plasma homocysteine and liver tissue S-adenosylmethionine, S-adenosylhomocysteine status in vitamin B6-deficient rats. Eur. Rev. Med. Pharmacol. Sci. 19, 154–160. Toriumi, K., Miyashita, M., Suzuki, K., Yamasaki, N., Yasumura, M., Horiuchi, Y., Yoshikawa, A., Asakura, M., Usui, N., Itokawa, M. and Arai, M. 2021. Vitamin B6 deficiency hyperactivates the noradrenergic system, leading to social deficits and cognitive impairment. Transl. Psychiatry. 11, 1–11; doi:10.1038/s41398-021-01381-z Ueland, P.M., Ulvik, A., Rios-Avila, L., Midttun, Ø. and Gregory, J.F. 2015. Direct and functional biomarkers of vitamin B6 status. Annu. Rev. Nutr. 35, 33–70; doi:10.1146/annurev-nutr-071714-034330 Yang, X., Teng, D., Wang, X., Guan, Q., Mao, R., Hao, Y. and Wang, J. 2016. Enhancement of nutritional and antioxidant properties of peanut meal by bio-modification with Bacillus licheniformis. Appl. Biochem. Biotechnol. 180(6), 1227–1242; doi:10.1007/s12010-016-2163-z Tang, Y., Xu, M., and Kuo, S-M. 2018. Factors contributing to the high prevalence of vitamin B6 deficiency in US: a systematic review. J. Hum. Nutr. 2(1), 58–64. doi:10.36959/487/282 Zhao, L.G., Shu, X.O., Li, H.L., Gao, J., Han, L.H., Wang, J., Fang, J., Gao, Y.T., Zheng, W. and Xiang, Y.B. 2018. Prospective cohort studies of dietary vitamin B6 intake and risk of cause-specific mortality. Clin. Nutr. 38(3), 1180–1187; doi:10.1016/j.clnu.2018.04.016 Zhao, Y., Zhao, T., Liu, X., Li, R. and Xiao, H. 2024. Vitamin B6 nutrition, metabolism, and the relationship of diseases: current concepts and future research. J. Futur. Foods. | ||
| How to Cite this Article |
| Pubmed Style Rohimah A, Setiawan B, Sulaeman A, Palupi E, Handharyani E, Nhestricia N, Rusli Z. Black oncom’s potential role in maintaining growth rate and vitamin B6 status of vitamin B6 deficiency model rats. doi:10.5455/OVJ.2026.v16.i1.52 Web Style Rohimah A, Setiawan B, Sulaeman A, Palupi E, Handharyani E, Nhestricia N, Rusli Z. Black oncom’s potential role in maintaining growth rate and vitamin B6 status of vitamin B6 deficiency model rats. https://www.openveterinaryjournal.com/?mno=271418 [Access: February 01, 2026]. doi:10.5455/OVJ.2026.v16.i1.52 AMA (American Medical Association) Style Rohimah A, Setiawan B, Sulaeman A, Palupi E, Handharyani E, Nhestricia N, Rusli Z. Black oncom’s potential role in maintaining growth rate and vitamin B6 status of vitamin B6 deficiency model rats. doi:10.5455/OVJ.2026.v16.i1.52 Vancouver/ICMJE Style Rohimah A, Setiawan B, Sulaeman A, Palupi E, Handharyani E, Nhestricia N, Rusli Z. Black oncom’s potential role in maintaining growth rate and vitamin B6 status of vitamin B6 deficiency model rats. doi:10.5455/OVJ.2026.v16.i1.52 Harvard Style Rohimah, A., Setiawan, . B., Sulaeman, . A., Palupi, . E., Handharyani, . E., Nhestricia, . N. & Rusli, . Z. (2026) Black oncom’s potential role in maintaining growth rate and vitamin B6 status of vitamin B6 deficiency model rats. doi:10.5455/OVJ.2026.v16.i1.52 Turabian Style Rohimah, Azizah, Budi Setiawan, Ahmad Sulaeman, Eny Palupi, Ekowati Handharyani, Nhadira Nhestricia, and Zaldy Rusli. 2026. Black oncom’s potential role in maintaining growth rate and vitamin B6 status of vitamin B6 deficiency model rats. doi:10.5455/OVJ.2026.v16.i1.52 Chicago Style Rohimah, Azizah, Budi Setiawan, Ahmad Sulaeman, Eny Palupi, Ekowati Handharyani, Nhadira Nhestricia, and Zaldy Rusli. "Black oncom’s potential role in maintaining growth rate and vitamin B6 status of vitamin B6 deficiency model rats." doi:10.5455/OVJ.2026.v16.i1.52 MLA (The Modern Language Association) Style Rohimah, Azizah, Budi Setiawan, Ahmad Sulaeman, Eny Palupi, Ekowati Handharyani, Nhadira Nhestricia, and Zaldy Rusli. "Black oncom’s potential role in maintaining growth rate and vitamin B6 status of vitamin B6 deficiency model rats." doi:10.5455/OVJ.2026.v16.i1.52 APA (American Psychological Association) Style Rohimah, A., Setiawan, . B., Sulaeman, . A., Palupi, . E., Handharyani, . E., Nhestricia, . N. & Rusli, . Z. (2026) Black oncom’s potential role in maintaining growth rate and vitamin B6 status of vitamin B6 deficiency model rats. doi:10.5455/OVJ.2026.v16.i1.52 |

