


| Research Article | ||
Open Vet J. 2023; 13(7): 819-825 Open Veterinary Journal, (2023), Vol. 13(7): 819–825 Original Research Computed tomographic characteristics of normal salivary glands in dogsSeongin Son1, Sang-Kwon Lee1, Sooyoung Choi2, Hojung Choi3, Youngwon Lee3 and Kija Lee1*1College of Veterinary Medicine, Kyungpook National University, Daegu, South Korea 2College of Veterinary Medicine, Kangwon National University, Chuncheon, South Korea 3College of Veterinary Medicine, Chungnam National University, Daejeon, South Korea *Corresponding Author: Kija Lee. College of Veterinary Medicine, Kyungpook National University, Daegu, South Korea. Email: leekj [at] knu.ac.krr Submitted: 20/03/2023 Accepted: 05/06/2023 Published: 31/07/2023 © 2023 Open Veterinary Journal
AbstractBackground: Various salivary gland diseases diagnosed on computed tomography (CT) in dogs have been reported. However, no study described the size and CT attenuation value of normal salivary glands in dogs. Aim: This retrospective analytical study aimed to evaluate the size and attenuation value of the mandibular and zygomatic salivary glands on CT in dogs without cervical or head lesions. Methods: The maximum cross-sectional area (MCSA) was measured in 96 dogs and attenuation value on non-contrast and postcontrast images were measured in 90 dogs. Dogs were divided into three groups based on body weight: group 1, ≤ 5.0 kg; group 2, 5.1–10.0 kg; and group 3, 10.1–15.0 kg. Results: There were significant differences in MCSA for both glands among the three groups. There was no difference in MCSA between the left and right sides in both salivary glands. The MCSA for both salivary glands positively correlated with body weight (p < 0.001). There was a significant difference in the MCSA of the zygomatic gland between males and females (p=0.02), but there was no significant difference in the mandibular gland. There was a significant difference in the attenuation value between the mandibular and zygomatic glands in non-contrast studies (p < 0.001), but there was no significant difference in postcontrast studies. Conclusion: This study established the reference for the size and attenuation value of the mandibular and zygomatic glands in dogs and provided background data for future CT evaluation of dogs with salivary gland diseases. Keywords: Canine, Computed tomography, Mandibular gland, Zygomatic gland. IntroductionSalivary gland diseases are common in dogs, and the most common salivary gland disease is nonspecific sialadenitis, including sialocele (Lieske and Rissi, 2020). Since most salivary gland diseases cause enlargement of the salivary glands (Spangler and Culbertson, 1991; Sozmen et al., 2000; Cannon et al., 2011; Alcoverro et al., 2014; Lieske and Rissi, 2020; Oetelaar et al., 2022), regional swelling of the cervical, sublingual, pharyngeal, and retrobulbar regions is the most common clinical symptom in dogs with salivary gland diseases. However, it is difficult to determine the cause of regional swelling and evaluate the changes in the salivary glands by physical examination (Heo et al., 2001; Durand et al., 2016; Lieske and Rissi, 2020). Therefore, additional imaging modalities are needed to determine the origin of facial swelling and accurately evaluate the changes in salivary glands (Durand et al., 2016). In addition, the attenuation value of the salivary gland changes on computed tomography (CT) in dogs with salivary gland neoplasia (Smrkovski et al., 2006; Lenoci and Ricciardi, 2015; de la Puerta and Emmerson, 2020) and inflammation (Cannon et al., 2011; Lee et al., 2014; de la Puerta and Emmerson, 2020). Similarly, in humans, changes in the size and attenuation value of the salivary glands are indicators of salivary gland diseases, including neoplastic, inflammatory, and metabolic diseases and hypersensitivity (Yonetsu et al., 1996; Heo et al., 2001). Therefore, it is important to evaluate salivary gland size and attenuation value in the diagnosis of salivary gland diseases, and to detect changes in the size and attenuation value of salivary glands, it is necessary to determine their normal reference values. Various imaging modalities, including radiography, ultrasonography, and CT, have been used to examine the salivary glands (Tadjalli et al., 2004; Durand et al., 2016; Oetelaar et al., 2022). In particular, cross-sectional imaging modalities such as CT provide detailed anatomical location by eliminating organ superimposition, provide soft tissue characterization using attenuation values, and allow assessment of local and regional extension and infiltration of lesions (Durand et al., 2016). CT is useful for the evaluation of salivary gland diseases, including tumor extent, sialadenitis, and sialolith, and differentiation of diseases of other neighboring organs (Bryan et al., 1982; Choi et al., 2000; Abdel Razek and Mukherji, 2017; de la Puerta and Emmerson, 2020; Oetelaar et al., 2022). Moreover, variable post-processing CT techniques provide more accurate two- and three-dimensional visualization (Walsh et al., 2013). A previous study on the normal anatomy and morphology of salivary glands in dogs on CT or magnetic resonance imaging was conducted (Weidner et al., 2012; Durand et al., 2016). Normal salivary glands show strong contrast enhancement and distinct border on CT, and the zygomatic glands are more clearly demarcated than the parotid and sublingual glands due to their size and location (Boroffka et al., 2011). However, the size and attenuation value of the normal salivary glands have not been reported in dogs. Moreover, in humans, various factors including age, body mass index, and sex could affect the size and attenuation values of the salivary glands on CT (Yonetsu et al., 1996; Inoue et al., 2006), but these factors have not been studied in dogs. We hypothesized that the size and attenuation value of the mandibular and zygomatic glands would be consistent among healthy dogs so that a reference range could be established. This study aimed to determine the size and attenuation value of the normal mandibular and zygomatic glands in dogs and evaluate their relationship to sex, age, and body weight. Materials and MethodsAnimalsThis retrospective analytical study enrolled dogs that underwent CT of the head at the Veterinary Medical Teaching Hospital of Kyungpook National University between January 2016 and September 2022. Patients with regional swelling of the neck or distortion of the salivary gland by adjacent lesions, including tumors and enlarged lymph nodes, and salivary gland diseases were excluded. Patients with oral diseases (including periodontitis and oral tumor) that may affect salivary gland secretion were also excluded. The medical records were reviewed, and the following data were recorded by one author with 2 years of experience in veterinary diagnostic imaging: breed, age, sex, and body weight. Dogs were classified into three groups based on body weight: group 1, ≤5 kg; group 2, 5.1–10.0 kg; and group 3, 10.1–15.0 kg. CT examinationAll dogs were fasted for 12 hours before anesthesia for CT scans. None of the dogs in this study were harmed in any way during premedication, and all study procedures were conducted in accordance with the rights and laws protecting animals in our country. All dogs were premedicated appropriately if necessary, and anesthesia was induced using propofol (6 mg/kg, intravenously) and maintained with 2% isoflurane. Under general anesthesia, the dogs were positioned in ventral recumbency on the CT table. CT was performed using a 32-multislice CT scanner (Alexion, Canon Medical Systems, Tokyo, Japan). The scanning parameters were as follows: 120 kV, 200 mA, and 1.0 mm slice thickness. The CT images were acquired from the nasal cavity to the axis. A contrast study was performed with intravenous administration into a cephalic vein of 600 mgI/kg Iohexol (Bonorex 300 Inj, Dai Han Pharm, Korea) for 20 seconds using an autoinjector. Postcontrast CT images of the delayed phase were obtained 90 seconds after injection. All CT data were reconstructed to the transverse plane with 1 mm slice thickness using soft tissue kernel and soft tissue window (window width, 450 HU; window level, 40 HU). The transverse images of the mandibular and zygomatic glands were obtained vertically to the spinous process of the axis and hard palate, respectively. Imaging assessmentThe maximum cross-sectional area (MCSA) of the bilateral mandibular and zygomatic glands was measured on non-contrast transverse CT images (Fig. 1). The region of interest (ROI) for MCSA was manually drawn including the largest area of the salivary glands. The attenuation was measured by drawing a circular ROI in each salivary gland on non-and postcontrast transverse images in all dogs (Fig. 2). The ROI was drawn as large as the anatomic configuration within each salivary gland, with the exception of obvious vascular areas. This ROI was created thrice in each salivary gland, and the attenuation value was defined as the mean of the three values. All measurements were performed by one author with 2 years of experience in veterinary diagnostic imaging, with consultation with another author with 15 years of experience in veterinary diagnostic imaging. Statistical analysisStatistical tests were selected with the aid of a consulting statistician and performed by one veterinarian with 2 years of experience in veterinary diagnostic imaging. All analyses were performed using a commercial software (SPSS 25.0, IBM SPSS Statistics, New York, NY). Descriptive statistics were used in the analysis of data including means, standard deviation (SD), and range in this study. All data were examined for normality using the Shapiro–Wilk test. The Kruskal–Wallis test was used to determine the difference in the MCSA of the mandibular and zygomatic glands among the three groups according to body weight. Games–Howell test was performed as a post hoc test to detect significant differences between groups. The paired t-test was used to assess the difference in MCSA and attenuation value of the mandibular and zygomatic glands between the right and left sides and the difference in attenuation value between the zygomatic and mandibular glands. The Pearson correlation test was used to examine the relationship between the MCSA of the salivary glands and age or body weight and attenuation value of the salivary glands and age or body weight. The difference in MCSA and attenuation value of the salivary glands according to sex was assessed using the Mann–Whitney U test. The difference in body weight according to sex was assessed using the Mann–Whitney U test. A p-value <0.05 was considered statistically significant in all analyses.
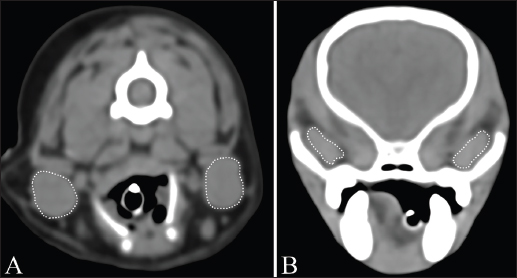
Fig. 1. Measurement of MCSA of bilateral mandibular glands (A) and zygomatic glands (B). Outlines of each salivary gland (dotted line) are drawn manually on CT images.
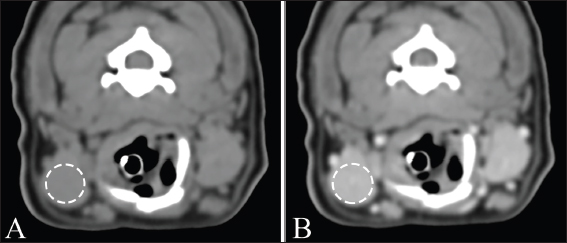
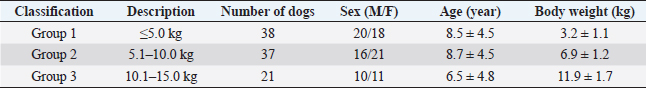
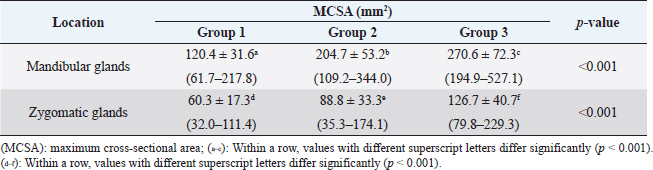
Fig. 2. Measurement of attenuation value of salivary gland on non-contrast (A) and postcontrast (B) CT images. The ROI of the mandibular gland (dashed circle) is drawn as large as possible. Ethical approvalDue to the retrospective study design, no institutional animal care approval was required. ResultsData were initially obtained from 175 dogs: 156 dogs that underwent non-and postcontrast studies, 6 dogs that underwent only non-contrast studies, and 13 dogs that underwent only postcontrast studies. Among these, 79 dogs were excluded: 39 dogs for distortion of the salivary glands with regional mass or lymphadenopathy, 21 dogs for inclusion of non-entire salivary glands, 13 dogs for only postcontrast study, and 6 dogs for salivary gland disease. After a review of the medical records and CT, a total of 96 dogs met the inclusion criteria in this study. The dogs consisted of 15 Maltese, 13 Beagles, 12 mixed, 11 Poodles, 11 Shih-Tzus, 9 Yorkshire Terriers, 8 Cocker Spaniels, 6 Pomeranian, 2 Dachshund, and one in each of French Bulldog, Jindo, Boston Terrier, Chihuahua, Coton de Tulear, Pekinese, Pompitz, Schnauzer, and Spitz. The mean age ± SD was 8.1 ± 4.6 years (range, 0.3–18.3 years), and the mean ± SD of body weight was 6.5 ± 3.5 kg (range, 1.1–15 kg). There were 50 females (18 intact and 32 spayed) and 46 males (15 intact, 31 castrated). There were 38, 37, and 21 dogs in groups 1, 2, and 3, respectively. Sex, age, and mean body weight of each group are summarized in Table 1. There was no significant difference in MCSA of the mandibular (p=0.21) and zygomatic glands (p=0.10) between the right and left sides. Table 2 shows the mean ± SD of MCSA of the mandibular and zygomatic glands for each group. There were significant differences in MCSA for both glands among the three groups classified based on body weight. There was a strong positive correlation between the MCSA and body weight in the mandibular (r=0.799, p < 0.001) and zygomatic salivary glands (r=0.627, p < 0.001). There was no correlation between the MCSA and age in the mandibular and zygomatic glands (p=0.44 and 0.38, respectively). In addition, there was no correlation between age and body weight (p=0.46). The MCSA of the mandibular glands in males and females were 189.1 ± 74.5 and 182.7 ± 80.5, respectively, and there was no significant difference between males and females (p=0.37). However, the MCSA of the zygomatic gland showed a significant difference between males and females (p=0.02), each MCSA of the zygomatic gland in males and females was 94.1 ± 44.1 and 78.2 ± 32.1, respectively. There was no significant difference in body weight (p=0.73) and age (p=0.11) between males and females. Table 1. Body weight, age, and sexual status in three groups according to body weight.
Table 2. MCSA of the mandibular and zygomatic glands in three groups based on body weight in dogs (n=96).
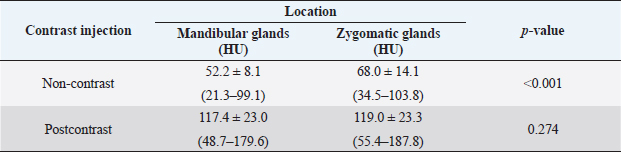
Attenuation values of mandibular and zygomatic glands were measured in 90 dogs with non-and postcontrast studies. The mean values ± SD of attenuation values of mandibular and zygomatic salivary glands are summarized in Table 3. There was a significant difference in attenuation value between mandibular and zygomatic glands on non-contrast images (p < 0.001). However, there was no significant difference in attenuation value between mandibular and zygomatic glands on postcontrast images. There was no significant correlation between non-contrast attenuation values and age at the mandibular (p=0.36) and zygomatic glands (p=0.89). However, there was a significant correlation between postcontrast attenuation values and age at mandibular (p < 0.001) and zygomatic glands (p=0.004). There was no significant correlation between non-or postcontrast attenuation values of the mandibular gland and sex (p=0.86 and 0.52, respectively). There was a significant correlation between non-contrast attenuation values of the zygomatic gland and sex (p=0.03). However, there was no significant correlation between postcontrast attenuation of the zygomatic gland and sex (p=0.89). There was no significant correlation between the non-or postcontrast attenuation values and body weight. DiscussionThis study described the quantitative analysis of the size and attenuation value of the mandibular and zygomatic salivary glands using CT in dogs without cervical or head lesions. In this study, CT readily enabled the assessment of the size and attenuation value of mandibular and zygomatic glands in dogs. The results of this study can be used as reference data for evaluating the size and attenuation value of the mandibular and zygomatic glands in dogs with salivary gland diseases. There was no difference in MCSA between the left and right sides of the mandibular and zygomatic glands in this study, and this result was consistent with those of a previous human study (Boroffka et al., 2011). In humans, sialadenitis could be suspected based on increased MCSA of the affected mandibular glands to the contralateral mandibular glands (Yonetsu et al., 1996). However, when the bilateral salivary glands are affected, it may be difficult to detect changes in size by comparing only the bilateral salivary glands. Therefore, the MCSA of the salivary glands of this study could be used as reference data to evaluate the enlargement of the mandibular and zygomatic glands in dogs. In this study, the MCSA of the salivary glands in dogs had a significant difference among the three groups according to body weight, and larger dogs tended to have higher MCSA of the salivary glands. This finding was consistent with those of human studies demonstrating a correlation between salivary gland size and height and body weight (Yonetsu et al., 1996; Inoue et al., 2006). Therefore, body weight should be considered in evaluating the size of the mandibular and zygomatic glands in dogs. This study provided the reference MCSA of the salivary glands according to the body weight in dogs weighing ≤15 kg. Further studies on MCSA of the salivary glands in large or giant breed dogs are needed to evaluate the size of the salivary glands according to various ranges of body weight. In addition, studies evaluating the relationship between salivary gland size and skull type or breed are required. Table 3. Attenuation value of the mandibular and zygomatic glands in dogs (n=90).
In this study, there was a positive correlation between the MCSA of the salivary glands and age. This finding was contrary to those in previous human studies that revealed that the size of salivary glands decreased with age (Yonetsu et al., 1996; Heo et al., 2001; Inoue et al., 2006). This may be the degree of change in constituent tissues of the salivary glands between dogs and humans. The parenchyma of the salivary glands in humans and rats with aging is gradually replaced by the adipose and fibrovascular tissues and decreases in the acinar tissue, and the degree of this change in constituent tissues was different between rats and humans (Scott et al., 1986; Mahne et al., 2007; de Almeida et al., 2008; Choi et al., 2013). Similar to those in humans and rats, the parenchymal cells of the salivary glands in dogs may change with aging; however, the degree of change in components may be different from those of humans or rats. The differences in salivary gland size between males and females have been reported (Yonetsu et al., 1996; Heo et al., 2001; Inoue et al., 2006; Mahne et al., 2007; de Almeida et al., 2008). Consistent with previous studies, the MCSA of zygomatic glands was higher in males than females in this study; however, there was no difference in the mandibular glands. Several possible reasons have been suggested for the different sizes of the salivary glands according to sex. First, a significant positive correlation between salivary gland size and weight can lead to differences in salivary glands between men and women (Yonetsu et al., 1996; Heo et al., 2001; Inoue et al., 2006). In this study, there was no difference in body weight between males and females, so body weight was not considered a cause of the difference in the MCSA of zygomatic glands. Second, the hormonal pattern and saliva flow rates in women may contribute to decreased salivary secretion, leading to a small size of salivary glands (Percival et al., 1994; Inoue et al., 2006; de Almeida et al., 2008). In this study, the effect of hormones on salivation may be considered negligible because more than half of the dogs were neutered. Finally, the effect of body mass index on the size of the glands and fat content was different depending on the type of salivary glands in human studies (Heo et al., 2001; Mahne et al., 2007). It was supposed that the difference in the size of the zygomatic glands between males and females may have been influenced by obesity, and the difference between the zygomatic and mandibular glands may be due to different amounts of fat tissue depending on the type of salivary glands. Further studies on salivary gland size in normal intact dogs and groups according to the degree of obesity are needed. There was a significant difference between the attenuation value of the mandibular and zygomatic glands in non-contrast studies. It may be due to the difference in the amount of fat in each salivary gland. Based on a previous human study, the amount of fat may be different depending on the salivary glands, and the content of adipose tissue affects the attenuation values of the salivary gland (Heo et al., 2001). The attenuation value of the mandibular glands is significantly higher than that of the parotid gland, due to the higher fat content of the parotid gland (Heo et al., 2001; Mahne et al., 2007). In addition, a previous study reported that both age and body mass index are closely correlated with the attenuation value of the major salivary glands (Heo et al., 2001). However, there were no relationships between the attenuation value and age and body weight in this study. In dogs, body weight would not have been indicative of obesity, and the correlation between the indicator of obesity and attenuation value was not determined in this study. Moreover, the number of investigated dogs may not be sufficient to analyze age-dependent attenuation values. A further study on the correlation between the degree of obesity and attenuation value and a larger population size is needed. In the postcontrast study, the attenuation values of the mandibular and zygomatic glands were 117.4 and 119 HU, respectively, with no significant difference. These values in the present study were lower than the value of 139 HU reported in a previous study (Jang et al., 2020). This may be due to the difference in scan time for postcontrast study. According to the previous study, the attenuation value is highest at 69 seconds after injecting contrast medium in dogs fasted for 12 hours, and the equilibrium value is reached at 80 seconds (Jang et al., 2020). Another study showed a large SD of time-to-peak enhancement of submandibular glands due to various interacting factors including patient-related factors, contrast medium-related factors, and CT scan-related factors (Jang et al., 2020). Patient-related factors that affect contrast enhancement mainly include body size and cardiac output; other relevant factors that may affect contrast enhancement include age, sex, venous access, renal function, hepatic cirrhosis, portal hypertension, and other pathological conditions (Bae, 2010). Therefore, in this study, in order to minimize the effect of inter-individual variability, the delayed phase scan performed 90 seconds after contrast injection was selected. There are several limitations to this study. First, salivary glands were considered normal by physical examination and CT images, and histopathological examination of the salivary gland was not performed. However, in previous human studies, the salivary glands were considered normal based on symptoms, history, physical examination, and CT images (Heo et al., 2001; Yonetsu et al., 1996). Second, this study was not performed according to the degree of obesity and neutralization that may affect the size or attenuation of the salivary glands. Third, the MCSA, not the volume, was measured to evaluate the size of the salivary glands. However, based on a previous study on the high correlation between MCSA and the volume of the mandibular gland in humans (Yonetsu et al., 1996), it may be possible to use the MCSA as an indicator of the size of the gland in dogs. In conclusion, normal canine mandibular and zygomatic glands were easily detected using CT, and MCSA and the attenuation values of normal mandibular and zygomatic glands were presented. We have verified in this study that dogs present a significantly different size in normal salivary glands according to the body weight or sex and different attenuation values in non-contrast images of salivary glands. This study established a reference for the size and attenuation values of normal mandibular and zygomatic glands in dogs and provided background data for CT evaluation of dogs with salivary gland diseases. AcknowledgmentsNot applicable. Conflict of interestThe authors declare that there is no conflict of interest. FundingThis research received no particular grant from any funding agency in the public, private, or not-for-profit sectors. Availability of dataThe data that support the findings of this study are available from the corresponding author, [Lee K.], upon reasonable request. Author contributionsConceptualization and experiment design: Seongin Son, Youngwon Lee, Kija Lee. Data curation: Sang-Kwon Lee, Sooyoung Choi, Hojung Choi, Kija Lee. Data collection and statistical analysis: Seongin Son, Sang-Kwon Lee, Sooyoung Choi, Kija Lee. Writing the first draft: Seongin Son. All authors contributed to the manuscript's editing and approving the final version. ReferencesAbdel Razek, A.A.K. and Mukherji, S. 2017. Imaging of sialadenitis. Neuroradiol. J. 30, 205–215. Alcoverro, E., Tabar, M.D., Lloret, A., Roura, X., Pastor, J. and Planellas, M. 2014. Phenobarbital-responsive sialadenosis in dogs: case series. Top. Companion. Anim. Med. 29, 109–112. Bae, K.T. 2010. Intravenous contrast medium administration and scan timing at CT: considerations and approaches. Radiology 256, 32–61. Boroffka (orbita), S., Dennison, S., Schwarz, T. and Saunders, J. 2011. Orbita, salivary glands and lacrimal system. In Veterinary computed tomography. Eds., Schwarz, T. and Saunders, J. West Sussex, UK: Wiley-Blackwell, pp: 137–151. Bryan, R.N., Miller, R.H., Ferreyro, R.I. and Sessions, R.B. 1982. Computed tomography of the major salivary glands. AJR. Am. J. Roentgenol. 139, 547–554. Cannon, M.S., Paglia, D., Zwingenberger, A.L., Boroffka, S.A., Hollingsworth, S.R. and Wisner, E.R. 2011. Clinical and diagnostic imaging findings in dogs with zygomatic sialadenitis: 11 cases (1990-2009). J. Am. Vet. Med. Assoc. 239, 1211–1218. Choi, D.S., Na, D.G., Byun, H.S., Ko, Y.H., Kim, C.K., Cho, J.M. and Lee, H.K. 2000. Salivary gland tumors: evaluation with two-phase helical CT. Radiology 214, 231–236. Choi, J.S., Park, I.S., Kim, S.K., Lim, J.Y. and Kim, Y.M. 2013. Analysis of age-related changes in the functional morphologies of salivary glands in mice. Arch. Oral. Biol. 58, 1635–1642. de Almeida, P.V., Grégio, A.M., Machado, M.A., de Lima, A.A. and Azevedo, L.R. 2008. Saliva composition and functions: a comprehensive review. J. Contemp. Dent. Pract. 9, 72–80. de la Puerta, B. and Emmerson, T. 2020. Salivary gland disease in dogs and cats. In. Pract. 42, 428–437. Durand, A., Finck, M., Sullivan, M. and Hammond, G. 2016. Computed tomography and magnetic resonance diagnosis of variations in the anatomical location of the major salivary glands in 1680 dogs and 187 cats. Vet. J. 209, 156–162. Heo, M.S., Lee, S.C., Lee, S.S., Choi, H.M., Choi, S.C. and Park, T.W. 2001. Quantitative analysis of normal major salivary glands using computed tomography. Oral. Surg. Oral. Med. Oral. Pathol. Oral. Radiol. Endod. 92, 240–244. Inoue, H., Ono, K., Masuda, W., Morimoto, Y., Tanaka, T., Yokota, M. and Inenaga, K. 2006. Gender difference in unstimulated whole saliva flow rate and salivary gland sizes. Arch. Oral. Biol. 51, 1055–1060. Jang, W., Hwang, T., Jung, D., Lee, J. and Lee, H. 2020. Quantitative assessment of salivary gland washout in clinically healthy dogs. J. Vet. Clin. 37, 28–33. Lee, N.S., Choi, M.H., Keh, S.Y., Kim, H.W. and Yoon, J.H. 2014. Zygomatic sialothiasis diagnosed with computed tomography in a dog. J. Vet. Med. Sci. 76, 1389–1391. Lenoci, D. and Ricciardi, M. 2015. Ultrasound and multidetector computed tomography of mandibular salivary gland adenocarcinoma in two dogs. Open. Vet. J. 5, 173–178. Lieske, D.E. and Rissi, D.R. 2020. A retrospective study of salivary gland diseases in 179 dogs (2010–2018). J. Vet. Diagn. Invest. 32, 604–610. Mahne, A., El-Haddad, G., Alavi, A., Houseni, M., Moonis, G., Mong, A., Hernandez-Pampaloni, M. and Torigian, D.A. 2007. Assessment of age-related morphological and functional changes of selected structures of the head and neck by computed tomography, magnetic resonance imaging, and positron emission tomography. Semin. Nucl. Med. 37, 88–102. Oetelaar, G.S., Heng, H.G., Lim, C.K. and Randall, E. 2022. Computed tomographic appearance of sialoceles in 12 dogs. Vet. Radiol. Ultrasound. 63, 30–37. Percival, R.S., Challacombe, S.J. and Marsh, P.D. 1994. Flow rates of resting whole and stimulated parotid saliva in relation to age and gender. J. Dent. Res. 73, 1416–1420. Scott, J., Bodner, L. and Baum, B.J. 1986. Assessment of age-related changes in the submandibular and sublingual salivary glands of the rat using stereological analysis. Arch. Oral. Biol. 31, 69–71. Smrkovski, O.A., LeBlanc, A.K., Smith, S.H., LeBlanc, C.J., Adams, W.H. and Tobias, K.M. 2006. Carcinoma ex pleomorphic adenoma with sebaceous differentiation in the mandibular salivary gland of a dog. Vet. Pathol. 43, 374–377. Sozmen, M., Brown, P.J. and Whitbread, T.J. 2000. Idiopathic salivary gland enlargement (sialadenosis) in dogs: a microscopic study. J. Small. Anim. Pract. 41, 243–247. Spangler, W.L. and Culbertson, M.R. 1991. Salivary gland disease in dogs and cats; 245 cases (1985-1988). J. Am. Vet. Med. Assoc. 198, 465–469. Tadjalli, M., Dehghani, S.N. and Basiri, M. 2004. Sialography in dog: normal appearance. Veterinarski. Arhiv. 74, 225–233. Walsh, S.L., Nair, A. and Hansell, D.M. 2013. Post-processing applications in thoracic computed tomography. Clin. Radiol. 68, 433–448. Weidner, S., Probst, A. and Kneissl, S. 2012. MR anatomy of salivary glands in the dog. Anat. Histol. Embryol. 41, 149–153. Yonetsu, K., Yuasa, K. and Kanda, S. 1996. Quantitative analysis of the submandibular gland using computed tomography. Dentomaxillofac. Radiol. 25, 97–102. | ||
| How to Cite this Article |
| Pubmed Style Son S, Lee S, Choi S, Choi H, Lee Y, Lee K. Computed tomographic characteristics of normal salivary glands in dogs. Open Vet J. 2023; 13(7): 819-825. doi:10.5455/OVJ.2023.v13.i7.2 Web Style Son S, Lee S, Choi S, Choi H, Lee Y, Lee K. Computed tomographic characteristics of normal salivary glands in dogs. https://www.openveterinaryjournal.com/?mno=146931 [Access: June 30, 2025]. doi:10.5455/OVJ.2023.v13.i7.2 AMA (American Medical Association) Style Son S, Lee S, Choi S, Choi H, Lee Y, Lee K. Computed tomographic characteristics of normal salivary glands in dogs. Open Vet J. 2023; 13(7): 819-825. doi:10.5455/OVJ.2023.v13.i7.2 Vancouver/ICMJE Style Son S, Lee S, Choi S, Choi H, Lee Y, Lee K. Computed tomographic characteristics of normal salivary glands in dogs. Open Vet J. (2023), [cited June 30, 2025]; 13(7): 819-825. doi:10.5455/OVJ.2023.v13.i7.2 Harvard Style Son, S., Lee, . S., Choi, . S., Choi, . H., Lee, . Y. & Lee, . K. (2023) Computed tomographic characteristics of normal salivary glands in dogs. Open Vet J, 13 (7), 819-825. doi:10.5455/OVJ.2023.v13.i7.2 Turabian Style Son, Seongin, Sang-kwon Lee, Sooyoung Choi, Hojung Choi, Youngwon Lee, and Kija Lee. 2023. Computed tomographic characteristics of normal salivary glands in dogs. Open Veterinary Journal, 13 (7), 819-825. doi:10.5455/OVJ.2023.v13.i7.2 Chicago Style Son, Seongin, Sang-kwon Lee, Sooyoung Choi, Hojung Choi, Youngwon Lee, and Kija Lee. "Computed tomographic characteristics of normal salivary glands in dogs." Open Veterinary Journal 13 (2023), 819-825. doi:10.5455/OVJ.2023.v13.i7.2 MLA (The Modern Language Association) Style Son, Seongin, Sang-kwon Lee, Sooyoung Choi, Hojung Choi, Youngwon Lee, and Kija Lee. "Computed tomographic characteristics of normal salivary glands in dogs." Open Veterinary Journal 13.7 (2023), 819-825. Print. doi:10.5455/OVJ.2023.v13.i7.2 APA (American Psychological Association) Style Son, S., Lee, . S., Choi, . S., Choi, . H., Lee, . Y. & Lee, . K. (2023) Computed tomographic characteristics of normal salivary glands in dogs. Open Veterinary Journal, 13 (7), 819-825. doi:10.5455/OVJ.2023.v13.i7.2 |

