


| Research Article | ||
Open Vet. J.. 2024; 14(12): 3539-3551 Open Veterinary Journal, (2024), Vol. 14(12): 3539-3551 Research Article Acute toxicity effects of ethylene glycol on lethal dose 50 (LD50), urine production, and histopathology change renal tubule cell in miceDewa Ketut Meles1, Imam Mustofa2*, Wurlina Wurlina2, Clarissa Audreylea Donova3, Essi Rayareswari Hidayanti3, Niluh Suwasanti4, Zulfi Nur Amrina Rosyada5, Aswin Rafif Khairullah6, Adeyinka Oye Akintunde7, Rheza Imawan Mustofa8, Satriawan Wedniyanto Putra9, Riza Zainuddin Ahmad6, Wasito Wasito6 and Ricadonna Raissa101Division of Basic Veterinary Medicine, Faculty of Veterinary Medicine, Universitas Airlangga, Surabaya, Indonesia 2Division of Veterinary Reproduction, Faculty of Veterinary Medicine, Universitas Airlangga, Surabaya, Indonesia 3Profession Program of Veterinary Medicine, Faculty of Veterinary Medicine, Universitas Airlangga, Surabaya, Indonesia 4Department of Clinical Pathology, Universitas Katolik Widya Mandala Surabaya, Surabaya, Indonesia 5Division of Animal Husbandry, Faculty of Veterinary Medicine, Universitas Airlangga, Surabaya, Indonesia 6Research Center for Veterinary Science, National Research and Innovation Agency (BRIN), Bogor, Indonesia 7Department of Agriculture and Industrial Technology, Babcock University, Ilishan-Remo, Nigeria 8Physician in Nayaka Hostpital, Surabaya, Indonesia 9Internship Physician in Rumah Sakit Angkatan Udara, Malang, Indonesia 10Department of Pharmacology, Faculty of Veterinary Medicine, Universitas Brawijaya, Malang, Indonesia *Corresponding Author: Imam Mustofa. Division of Veterinary Reproduction, Faculty of Veterinary Medicine, Universitas Airlangga, Surabaya, Indonesia. Email: imam.mustofa [at] fkh.unair.ac.id Submitted: 16/10/2024 Accepted: 20/11/2024 Published: 31/12/2024 © 2024 Open Veterinary Journal
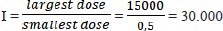
AbstractBackground: The LD50 (lethal dose causing 50% mortality) of ethylene glycol (EG) and its associated toxicity in mice (Mus musculus) were assessed by evaluating kidney function. Aim: This study aimed to determine the acute toxicity of an oral lethal dose of 50% (LD50) of EG, also degeneration, necrosis, and inflammatory cell invasion in kidney tubules of male rats (Rattus norvegicus) as an animal model. Methods: There were 66 DDG (Deutschland Denken Yoken) mice in 11 groups of six in this investigation. The daylong metabolic cage study contained one control (C) and 10 treatment groups that received different EG doses. EG’s daily BW/kg dosage varied from 0.5 mg/kg to 15,000 mg/kg. The treatment group was given a single dose of EG at a dose of T1=0.5 mg/kg BW, T2=1.57 mg/kg BW, T3=4.94 mg/kg BW, T4=15.54 mg/kg BW, T5=48.84 mg/kg BW, T6=153.55 mg/kg BW, T7=482.74 mg/kg BW, and T8=1517.66 mg/kg BW T9=4771.24 mg/kg BW, T10=14999.99 ≈ 15. 000 mg/kg BW. One-way Analysis of Variance testing was used to analyze the data. Results: The LD50 value of EG in mice was determined to be 1.598 mg/kg BW, classifying EG as “Slightly Toxic.” According to renal histopathology, EG dosage increased renal tubular degeneration, necrosis, and interstitial inflammatory cell infiltration. Acute renal impairment and lower urine output were observed in the EG (4.94 mg/kg—1517.66 mg/kg BW). Histologically, EG levels are associated with renal tubular cell degeneration, necrosis, and interstitial inflammatory cell growth. Conclusion: Acute EG exposure caused renal failure in male mice. Acute exposure to EG causes renal tubular cell degeneration and inflammation, indicating toxicity and health hazards. Keywords: Disease, EG, LD50, Renal, Toxic. IntroductionSeveral hospitals in Indonesia have documented cases of atypical progressive acute kidney failure, also known as acute kidney injury (AKI), in young adults. From the period leading up to October 18, 2022, over 206 instances of mortality with a fatality rate of 65% were attributed to the ingestion of syrup believed to be tainted with ethylene glycol (EG) or diethylene glycol. According to the Ministry of Health of the Republic of Indonesia’s report until November 16, 2022, of the 324 cases of acute kidney disease, 199 children died after eating syrup liquid contaminated with EG and DG. EGEG toxicity is an infrequent type of toxicity. Nevertheless, it results in approximately 100 fatalities annually in the United States (Ghannoum et al., 2023). AKI is characterized by a sudden decline in kidney function within hours to days (Makris and Spanou, 2016). AKI is diagnosed based on elevated serum creatinine, blood urea nitrogen (BUN), and decreased urine output. Changes in serum BUN and creatinine levels indicate impaired extracellular volume or reduced blood flow to the kidneys. Decreased urine output is an early symptom of acute renal failure caused by EG poisoning. This is because of damage to the renal tubules from exposure to EG and its metabolite products. Increased levels of EG in the body can cause calcium oxalate crystallization in renal tubules, resulting in kidney cell damage (Hovda et al., 2010). EG is a colorless and odorless chemical molecule generated from alcohols. It has a sweet taste and is commonly used in several sectors, including textiles, polyester fibers, paints, plastics, and antifreeze (Jobson et al., 2015). EG, or EG, is frequently used as a coolant in engines and cooling systems. EG contamination that enters the body through food products and medicinal mixtures, either as a solvent or as other adjuvants, is metabolized by the body, namely by the enzyme alcohol dehydrogenase, into acidic metabolites that cause metabolic acidosis. The metabolites of EG, especially glycolic acid, glyoxylic acid, and oxalate, play a role in causing toxic effects on organs including the kidneys, liver, brain, lungs, and heart (van Leent et al., 2024). EG is very dangerous if ingested by humans because it can trigger the formation of toxic metabolites in the form of glycolic acid, glyoxylic acid, and oxalic acid. High levels of body acids due to these compounds will cause the body to experience metabolic acidosis accompanied by hypocalcemia (calcium deficiency) and the formation of calcium oxalate crystal deposits in organs such as kidneys and blood vessels, which can cause fatal damage to the function and structure of the kidneys, liver, nervous system, and digestive system, leading to death (Makris and Spanou, 2016). The toxicity of a substance can be determined by conducting an acute toxicity test by selecting the LD50 value and the toxicity level of the compound. A lethal dose of 50 or LD50 is a dose that can kill as much as 50% of the experimental animal population within 24 hours (Erhirhie et al., 2018). The results of LD50 value calculation may vary depending on the type of experimental animal and research instruments used, such as species, strain, sex, age, maintenance method, cage, room temperature, and laboratory conditions (Hamm et al., 2021). Certain substances can have different LD50 values because of their different routes of administration (Dearden and Hewitt, 2021). Approximately 80% of EG is metabolized in the liver, while another 80% is reabsorbed in the proximal tubules. The remaining 20% were eliminated using urine. EG is commonly called a “sweet killer” because of its sweet taste and lack of irritation to the oral mucosa (Song et al., 2017). The toxicity of EG increased with the dosage administered. At lower doses, the potential adverse effects of this medication include headaches, dizziness, nausea, vomiting, and gastrointestinal issues. High doses of EG can result in severe poisoning of the central nervous system and kidneys (Gallagher and Edwards, 2019). Therefore, this study aimed to determine the acute toxicity of oral lethal dose of 50% (LD50) of EG, also degeneration, necrosis, and inflammatory cell invasion in kidney tubules of male rats (Rattus norvegicus) as animal models. Materials and MethodsStudy designThis research is a laboratory experimental research using a Completely Randomized Method. Design with posttest-only control group design. This study aimed to determine the LD50 value and effect of EG dose on kidney function between groups based on urine production in male mice. Doses of EGThe calculation of the LD50 value of EG in mice (Mus musculus) was carried out using the arithmetic formula of Reed and Muench (1938) for a series of treatment doses. This study used the smallest EG dose of 0.5 mg/kgBB/day following the Tolerable Daily Intake of EG as contamination and the largest dose based on dose exploration was 15000 mg/kgBB/day. Calculation of EG dosage series using the Reed and Muench (1938) multiplier factor formula Reed and Muench multiplier formula: F=r√I Note: F=Multiplier factor R=n-1=10-1=9
Calculation of the large multiplier factor: F=r√I =9√30000 =3,14382 Calculation of EG dose series (in mg/kg units): P1=0.5 mg/kg P2=0.5 mg/kg × 3.14382=1.57191 mg/kg P3=1.57191 mg/kg × 3.14382=4.94180 mg/kg P4=4.9418 mg/kg × 3.14382=15.53613 mg/kg P5=15.53613 mg/kg × 3.14382=48.84281 mg/kg P6=48.84281 mg/kg × 3.14382=153.55302 mg/kg P7=153.55302 mg/kg × 3.14382=482.74306 mg/kg P8=482.74306 mg/kg × 3.14382=1,517.65728 mg/kg P9=1,517.65728 mg/kg × 3.14382=4,771.24133 mg/kg P10=4,771.24133 mg/kg × 3.14382=14,999.9 ≈ 15,000 mg/kg Formula for determining LD50: LD50=Anti Log (Log A+ (B x Log C) Description: A=Dose under 50 % B=Proporsional space
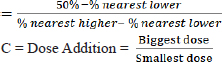
Based on the formula above, the result of the LD50 calculation of EGcol in mice (Mus musculus) is 1.598 mg/kg bb The formula for converting EG doses from mg/kg to ml/head is:
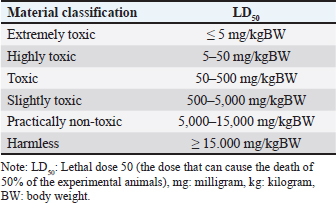
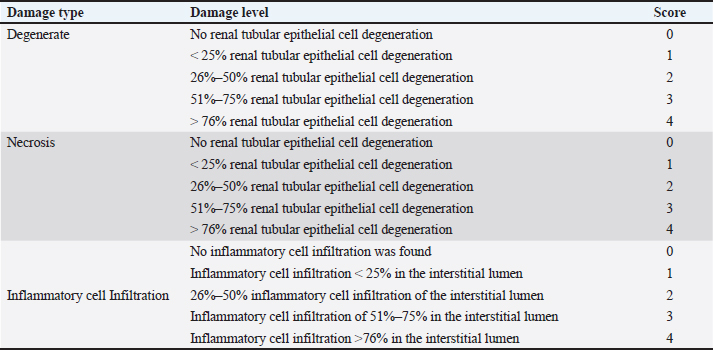
TreatmentSixty six male mice (Mus musculus starin of Deutschland, Denken, and Yoken) were randomly divided into 11 groups, namely C, T1, T2, T3, T4, T5, T6, T7, T8, T9, and T10. Distilled water (0.5 ml of distilled water was administered orally to the control group. The treatment group was given a single dose of EG orally at a dose of T1=0.5 mg/kg BW, T2=1.57 mg/kg BW, T3=4.94 mg/kg BW, T4=15.53 mg/kg BW, T5=48.84 mg/kg BW, T6=153.55 mg/kg BW, T7=482.74306 mg/kg BW, T8=1,517.66 mg/kg BW, T9=4,771.24 mg/kg BW, T10=14,999.99 ≈ 15,000 mg/kg BW. Measurement of parametersThe number of animals that died and their urine samples were collected after 24 hours of treatment. The toxicity levels of EG were examined based on the toxicity scale established by Loomis and Hayes (1996) (Table 1). Histopathological examination of the kidneys was performed to determine the level of damage to renal tubular cells. The examination used 100x and 400x magnification light microscope (Nikon Eclipse Ci) equipped with Image Raster Software Version 3.7., with observations from five fields of view. An assessment was then made in the form of scoring based on the level of damage to the renal histopathology picture. The following are the criteria (Table 2) for assessing changes in the histopathological picture of the kidneys according to Klopfleisch (2013). The collected data were analyzed using the Statistical Package for the Social Sciences (SPSS) 25.0, for Windows program using a one-way Analysis of Variance test. If there was a treatment difference, it was continued with the Games-Howell Test at p < 0.05. Data analysisData were analyzed with the Kruskal-Wallis test, and if there were significant differences (p < 0.05), then continued with the Mann-Whitney test at 95% levels of confidence. The data analysis was done using Statistical Package for the Social Sciences (SPSS) version 20 for Windows. Ethical approvalThis study was conducted at the Experimental Animal Cage of the Faculty of Veterinary Medicine, Airlangga University, Surabaya, Indonesia, between February and March 2023. The research proposal was approved by the Ethical Clearance Committee for preclinical research, Airlangga University, under ethical permission No. 227/HRECC.FODM/III/2023. ResultsLD50Acute toxicity of oral LD50 value of EG on mice was determined to be 1.598 mg/kg BW. This value falls into the slightly toxic” category according to the Loomis and Hayes (1996) toxic substance classification scale (Table 2). The calculation of the LD50 value of EG in mice (Mus musculus) was carried out using the arithmetic formula of Reed and Muench (1938). Based on the above formula, the LD50 of EGss in mice (Mus musculus) was 1.598 mg/kg BW. Based on ATSDR data in 2010, the range of LD50 values of EGcol administered orally to mice was 5,840–15,400 mg/kgBB. The difference in LD50 values can occur because of various factors, which can be grouped into three main factors: experimental animals, substances/compounds used, and external factors, including the environment and calculation methods (Casarett and Doull 1995). Table 1. Toxicity scale of toxic materials (Loomis and Hayes, 1996).
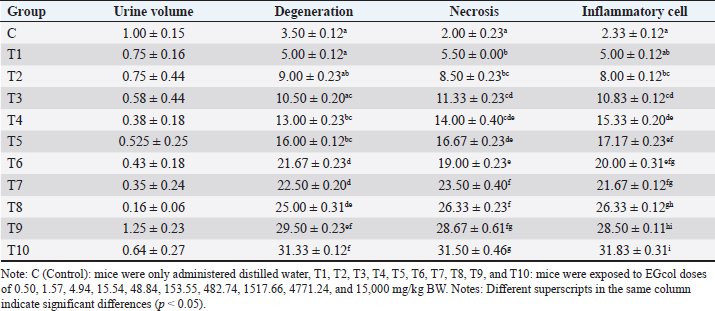
Urine volumeIn the control group (C), the average cumulative urine volume over 24 hours was 1.00 ± 0.147 ml/mice under normal circumstances (Table 5, Figs. 1 and 2). The C values are consistent with the 0.5–1.0 ml daily urine output volume calculated for healthy adult mice (Hrapkiewicz et al., 2013). Based on data from the toxicity results of EG with EG doses of 4.94 mg/kgBW (T3) to 1517.66 mg/kgBW (T8) caused a significant decrease in urine production, especially at a dose of 1517.66 mg/kgBW (T8) an estimated decrease of 84%. from normal urine volume. The results of observations of urine volume production there is a decrease in urine volume as the dose given increases, seen in the T3 group with an average urine collected 0.575 ± 0.444 ml/mice to T8 with an average urine volume of 0.162 ± 0.059 ml/mice (Table 5). The volume of urine collected in the T4 group with an EG dose of 15.54 mg/head/kg bw showed a significant decrease in urine volume estimated to decrease 63% from normal urine volume with an average of 0.375 ± 0.182 ml/mice (Table 5). The urine volume collected from the T6 group with an EG dose of 153.55 mg/head/KgBB showed a significant decrease in urine volume estimated to decrease by 58% from normal urine volume with a mean of 0.425 ± 0.184 ml/mice shown in Table 5. The mean urine volume collected from the T8 group with an EG dose of 1517.66 mg / kgbb was 0.162 ± 0.059 ml/25 g/24 hours, showing signs of AKI with a decrease in urine volume according to KDIGO criteria. KDIGO criteria for AKI patients are urine volume <0.5 ml/kgBB/hour for 6 hours converted to urine volume <0.3 ml/25 g /24 hours. Based on the data, the T9 group with an EG dose of 4771.24 mg/kg BW showed an increase in urine volume with a mean of 1.25 ± 0.234 ml/mice, estimated to increase 25% of normal urine volume, accompanied by the death of experimental animals at 18 hours after dosing EG. Meanwhile, in T10, a cumulative urine volume of 2.55 ml was obtained in only 12 hours due to the death of all experimental animals in the T10 group. Table 2. Scoring the degree of renal histopathologic changes.
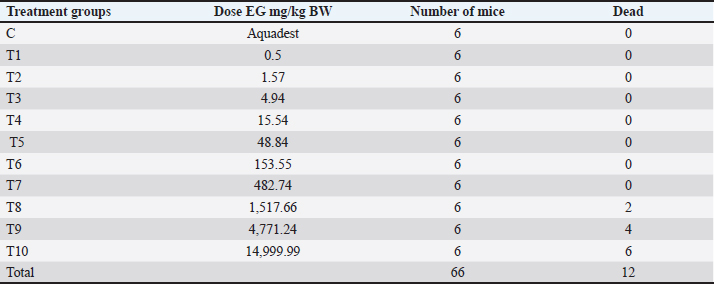
Table 3. Results of acute toxicity test of EGcol on mice.
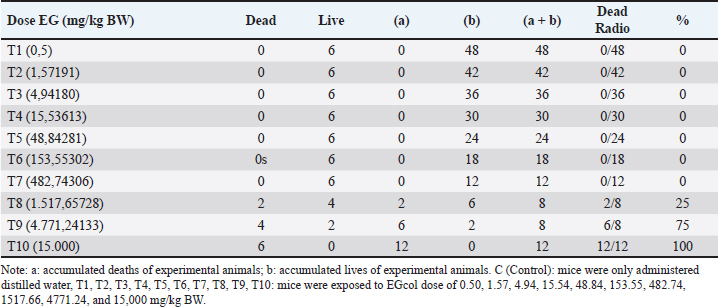
The mean urine volume collected from the T8 group with an EG dose of 1517.66 mg/kgbb was 0.1625 ml/25 g/24 hours, showing signs of AKI with a decrease in urine volume according to KDIGO criteria. KDIGO criteria for AKI patients are urine volume <0.5 ml/kg BW/hour for 6 hours converted to urine volume <0.3 ml/25 g/24 hours. Based on the data, the T9 group with an EG dose of 4771.24 mg/kg BW showed an increase in urine volume with a mean of 1.25 ± 0.234 ml/mice/24 hours, estimated to increase 25% of normal urine volume, accompanied by the death of experimental animals at 18 hours after dosing EG. Meanwhile, at T10, a cumulative urine volume of 2.55 ml was obtained in only 12 hours due to the death of all experimental animals in the T10 group. Table 4. Live/dead accumulation and mortality ratio of mice.
Table 5. Urine volume (ml/head/day), scores of renal tubular cell degeneration, necrosis, and inflammatory cell infiltration.
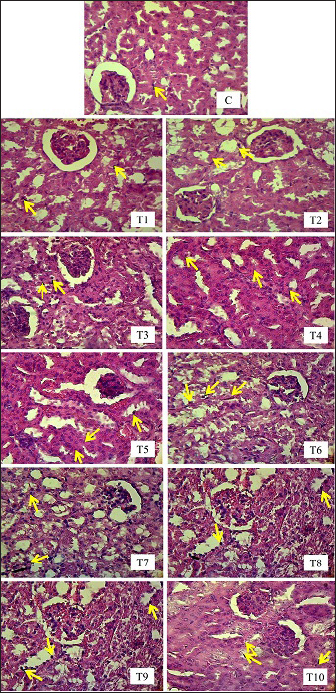
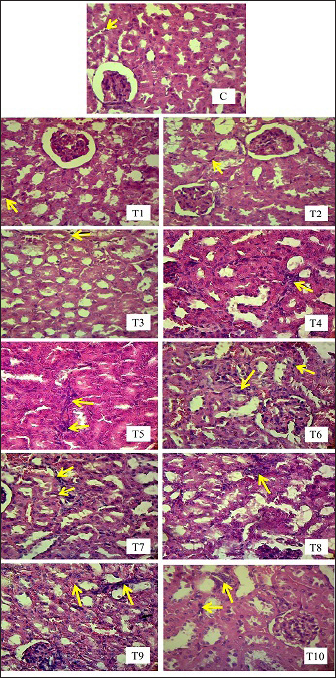
Renal tubule cell degenerationObservation of damage to the kidneys of male mice (Mus musculus) in the form of renal tubular cell degeneration was carried out microscopically using histopathology preparations with a magnification of 400x. The presence of hydropic degeneration is characterized by enlarged cells and cell cytoplasm that looks cloudy and normal nuclei. Fatty degeneration is characterized by the presence of clear vacuoles that push the cell nucleus to the edge of the cell (Fig. 3). In Table 5, there is a significant difference (p < 0.05) between group C and groups T4, T5, T6, T7, T8, T9, and T10 and not significantly different (p > 0.05) with groups T1, T2, and T3. Group C showed the lowest mean rank value of renal tubular cell degeneration and group T10 showed the highest mean rank value. There was a significant difference (p < 0.05) between group T1 and groups T4, T5, T6, T7, T8, T9, and T10 and not significantly different (p > 0.05) with groups T2, T3. Group T2 showed a significant difference (p < 0.05) with T6, T7, T8, T9, T10 and not significantly different (p > 0.05) with Group T3, T4, and T5. Group T3 showed a significant difference (p < 0.05) with T6, T7, T8, T9, and T10 and did not differ significantly (p > 0.05) with groups T4, T5. Group T4 was not significantly different (p > 0.05) with T5, but significantly different (p < 0.05) with T6, T7, T8, T9, and T10. Group T5 showed a significant difference (p < 0.05) with T6, T7, T8, T9, and T10. Group T6 showed a significant difference (p < 0.05) with T9 and T10. Group T7 showed a significant difference (p < 0.05) with T9 and T10. Group T8 showed a significant difference (p < 0.05) with T10. Furthermore, group T9 did not differ significantly (p > 0.05) from T10 (Table 5). Groups T1, T2, T3, T4, T5, T6, T7, T8, T9, and T10 showed an increase in mean rank value compared to group C. The increase in mean-rank value in groups T1 to T10 was directly proportional to the increase in the dose of EG administered. The histopathological picture of the observation of renal tubular cell degeneration in each group can be seen in the following Figure 3. Renal tubular cell necrosisObservation of damage to the kidneys of male mice (Mus musculus) in the form of renal tubule cell necrosis was carried out microscopically using histopathology preparations with a magnification of 400x (Fig. 4). Necrosis is characterized by cell nuclei breaking and becoming fragments (karyorrhexis), cell nuclei fading or disappearing (karyolysis), and cell nuclei becoming condensed and dark (pyknotis). In the table above, there is a significant difference (p < 0.05) between group C and groups T1, T2, T3, T4, T5, T6, T7, T8, T9, and T10. Group C showed the lowest mean rank value of renal tubular cell necrosis, and group T10 showed the highest mean rank value. There was a significant difference (p < 0.05) between group T1 and groups T3, T4, T5, T6, T7, T8, T9, and T10 and not significantly different (p > 0.05) with group T2. The T2 group showed a significant difference (p < 0.05) with T5, T6, T7, T8, T9, and T10 and was not significantly different (p > 0.05) with the T3, T4 groups. The T3 group showed significant differences (p < 0.05) with T6, T7, T8, T9, and T10 and not significantly different (p > 0.05) with the T4, T5 groups. The T4 group was not significantly different (p > 0.05) from T5 and T6 but was significantly different (p < 0.05) from T7, T8, T9, and T10. The T5 group showed a significant difference (p < 0.05) with T7, T8, T9, T10 and not significantly different (p > 0.05) with T6. The T6 group showed significant differences (p < 0.05) with T7, T8, T9, and T10. The T7 group showed a significant difference (p < 0.05) with T10. The T8 group showed a significant difference (p < 0.05) with T10. Furthermore, the T9 group was not significantly different (p > 0.05) from T10. The mean rank values of groups T1, T2, T3, T4, T5, T6, T7, T8, T9, and T10 were higher than those of group C. The increase in the EG dosage administered was directly correlated with the rise in mean rank values in groups T1 through T10 (Table 5).
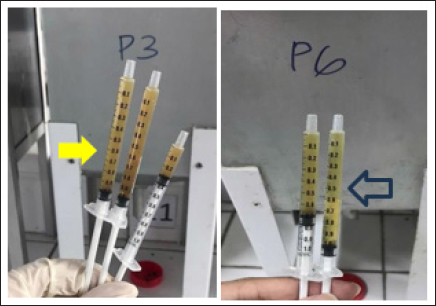
Fig. 1. Urine was collected after 24 hours of treatment from T3 and T6. Yellow arrow=urine from T3 in yellow color, blue arrow=urine from T6 in yellow color.
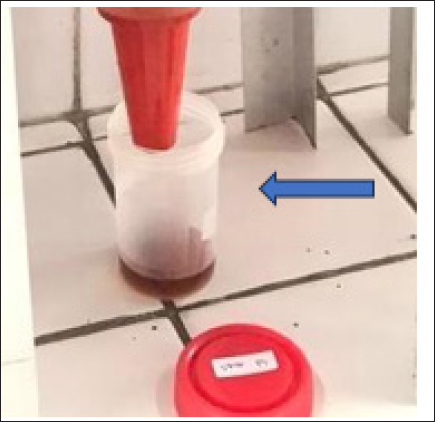
Fig. 2. Urine collected from T9 showed signs of hematuria. Blue arrow=urine in red color. The histopathological picture of the results of observations of renal tubular cell necrosis in each group can be seen in the following Figure 4. Inflammatory cell infiltration of renal tubulesObservation of kidney damage in male mice (Mus musculus) in the form of inflammatory cell infiltration was carried out microscopically using histopathology preparations with a magnification of 400x. Inflammatory cell infiltration can be observed in the interstitium of the renal tubules (Fig. 5). The table above shows that there is a significant difference (p < 0.05) between group C and groups T2, T3, T4, T5, T6, T7, T8, T9, T10, and not significantly different (p > 0.05) with group T1. Group C showed the lowest mean rank value of inflammatory cell infiltration, and group T10 showed the highest mean rank value. There was a significant difference (p < 0.05) between group T1 and groups T3, T4, T5, T6, T7, T8, T9, T10 and not significantly different (p > 0.05) with group T2. The T2 group showed a significant difference (p < 0.05) with T4, T5, T6, T7, T8, T9, T10 and was not significantly different (p > 0.05) with the T3 group. The T3 group showed significant differences (p < 0.05) with T5, T6, T7, T8, T9 and T10 and not significantly different (p > 0.05) with the T4 group. The T4 group was not significantly different (p > 0.05) from T5 and T6 but was significantly different (p < 0.05) from T7, T8, T9, and T10. The T5 group showed a significant difference (p < 0.05) with T8, T9, T10 and not significantly different (p > 0.05) with T6, T7. The T6 group showed a significant difference (p < 0.05) with T9 T10 and not a significant difference (p > 0.05) with T7, T8. The T7 group showed a significant difference (p < 0.05) with T9 T10 and was not significantly different (p > 0.05) with T8. The T8 group showed a significant difference (p < 0.05) with T10. Furthermore, the T9 group was not significantly different (p > 0.05) from T10 (Table 5).
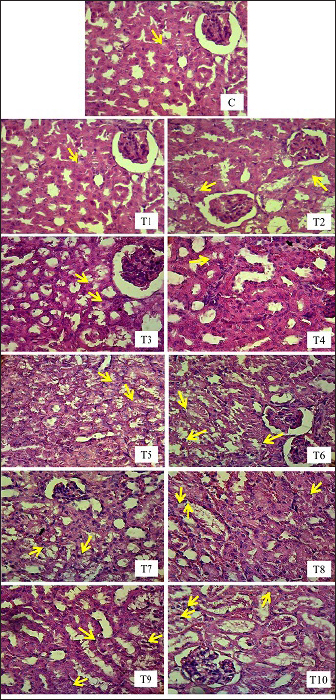
Fig. 3. Histopathologic picture of cell degeneration of kidney tubules of male mice (Mus musculus) in each treatment with H.E staining, 400x magnification under light microscope (Nikon Eclipse Ci) equipped with Image Raster Software Version 3.7. The yellow arrows indicates degeneration).
Fig. 4. Histopathological picture of renal tubular cell necrosis of male mice (Mus musculus) in each treatment with H.E staining, magnification 400x, under light microscope (Nikon Eclipse Ci) equipped with Image Raster Software Version 3.7. The yellow arrows indicate degeneration). Groups T1, T2, T3, T4, T5, T6, T7, T8, T9, and T10 showed an increase in mean rank values compared to group C. The increase in mean rank values in groups T1 to T10 was directly proportional to the increase in the dose of EG given. The histopathological picture resulting from observations of inflammatory cell infiltration in the interstitium of the renal tubules in each group can be seen in the following Figure 5. DiscussionLD50The first factor is the criteria of the experimental animals used, such as differences in species and strains, body weight, age, sex, physiology, metabolism of the body of experimental animals, and physical and psychological health conditions. Within the same species, strains play a significant role in determining the LD50 value becausse they possess different properties and gene characteristics, such that the body’s response to a toxic compound will not be the same between one strain and another (Spurgeon et al., 2020). Among various rodent species, rats (Rattus norvegicus) are more sensitive than mice (Mus musculus) to the acute and chronic toxicity effects of EG (Fowles et al., 2017). In humans, the estimated lethal dose of EG is in the range–1400–1600 mg/kg body weight (Tanasescu et al., 2014). When analyzed from these estimated lethal doses, humans are more susceptible to the acute toxicity effects of EG than other living species (Erhirhie et al., 2018). Thus, humans are by far the most sensitive to the toxic effects of EG compounds, with the safe limit set by the WHO at 0.5 mg/kg body weight per day. Mice have genes that are more susceptible to toxic effects; therefore, the LD50 values obtained are relatively smaller than those of other mouse strains (Löscher et al., 2017). Body weight affects the dose used and duration of toxic effects. Animals with higher body weights require higher doses. This is because of the greater ability of the compound to spread throughout the body (Martinez 2011). Age is related to the ability of organs to function. Young and old animals are more susceptible to toxic effects than are adults. This is because animals that are too young have imperfect organ function, whereas old animals have decreased organ function. The Mice used in this study were of optimal adult age, namely, 3 months, so they had good organ function capabilities and were fully mature. Female animals are more vulnerable than male animals because of differences in hormone activity (Fowles et al., 2017). Female animals have more fluctuating hormonal levels and experience more frequent changes and depression than male animals, which can trigger inflammation in astrocytes in the brain (Marchette et al., 2018). This is also related to the psychological and physical health of the test animals. The Mice used in this study were male; therefore, they had hormonal levels that were more stable, healthy, and not easily agitated.
Fig. 5. Histopathological image of inflammatory cells in the interstitial tubules of male mice (Mus musculus) in each treatment using H.E staining, magnification 400x under light microscope (Nikon Eclipse Ci) equipped with Image Raster Software Version 3.7. The yellow arrows indicate degeneration). The second factor that can cause differences in LD50 calculations is the criteria for the substance/compound being tested, such as the type of chemical substance/compound, route of administration, time and duration of administration, purity/purity levels, solubility of the material, foreign body contamination, and the dose used. EG is an ethyl alcohol derivative compound, which is metabolized in the liver and can precipitate in the kidneys, making it fatal to the body (Porter 2012). This makes EG a compound that has a considerable toxic effect because these two organs are the most affected by the metabolic results of EG. LD50 values can differ significantly among oral, inhalation, and topical routes of administration because they can directly and indirectly affect the body’s immune response to the compound (Wang et al., 2015). The lungs are the first organs to suffer harm when a drug or material is inhaled because it enters the bloodstream through the pulmonary alveoli without first passing through the liver. When EG is administered orally to DDY mice, the effects are maximal and require a longer period of intoxication because the drug passes through the digestive system, is absorbed into the bloodstream through the intestine, and is metabolized in the liver and kidneys. Oral materials may result in symptoms such as weakness, vomiting, and diarrhea. The hazardous effects of a compound, whether acute or chronic, are influenced by the timing and duration of treatment (Fowles et al., 2017). This is also related to the condition of the stomach, which is empty or filled when administering the substance. If it is empty, then the ability of the substance/compound to work will be more optimal. Mice that are fasted beforehand are more exposed to toxic effects because the work of toxins or substances is not disturbed by the presence of food in the stomach. The impurity of the substance/compound also affects the ability of the substance to provide an actual toxic effect (Spurgeon et al., 2020). The toxic effects of drugs may decrease or increase, depending on the contamination of foreign substances or objects. The EG used must be pure to obtain an unbiased toxic effect (99.8% pure EG, 0.2% water). The compound/substance used if in the form of a liquid, must be homogeneous to optimize the ability of organ intoxication to provide an even toxic effect directly proportional to the metabolic products produced in the body, and this can be seen significantly using graded doses (Webb and Craig 2020). The third factor that can cause differences in LD50 values is external factors in the form of environment, such as temperature, light, humidity, feed, water, and cages. The test environment directly affected the performance of experimental animals. Another external factor is the calculation method or statistical approach. The required number of experimental animals used and calculation methods that continue to evolve can affect the LD50 values (Van Norman 2019). The determination of the number of animals, as well as the selection of calculation methods, should be in accordance with predetermined procedural and ethical standards and the most accurate level of effectiveness, based on each researcher’s instrument and objectives. Urine volumeThe results showed that the administration of EG at a dose of 0.5mg/kg BW to 1517.66 mg/kg BW caused a decrease in urine production in mice. A decrease in urine output called oliguria occurs due to kidney damage caused by EG and its metabolites. Oliguria is included in several international guidelines for acute kidney damage [Acute Kidney Injury Network (AKIN), RIFLE, and Kidney Disease Improving Global Outcomes (KDIGO)]. The T9 group, with an EG dose of 4771.24 mg/kg BW, showed polyuria with a cumulative total urine output of 5 ml in 18 hours, followed by the death of the experimental animals. Toxic EGcol metabolites can interfere with the ability of the renal tubules to reabsorb water and concentrate urine properly. This impaired water reabsorption can result in excessive urine production and polyuria. Exposure to high doses of EG can result in death before the development of overt renal oxalosis. This is thought to be due to only a small fraction of the EG being ingested, which results in the formation of calcium oxalate crystals. Precipitation of calcium oxalate in the urine further exacerbates renal damage through crystal-induced nephropathy (Perazella and Herlitz 2021). EG is metabolized in the body and broken down into several toxic byproducts, such as glycolic acid, glyoxylic acid, and oxalic acid. These toxic by-products can cause damage to the renal tubules, which filter waste products and excess fluid from the blood to form urine. Damaged renal tubules become less efficient in their function, leading to decreased urine production and excretion. These metabolites can cause direct kidney damage and impaired kidney function (Rhee 2018). In another study, it was concluded that glycolaldehyde and glyoxylate are the main metabolites responsible for the nephrotoxicity of EG, which causes reduced adenosine triphosphate (ATP) and the destruction of phospholipids and enzymes. Glycine and acidosis, metabolic byproducts of EG, can cause further glyoxylate-mediated renal damage. This suggests that a naturally occurring but incomplete protective pathway may have prevailed during the evolution of EG cytotoxicity (Khawar and Sun 2021). The main cause of renal failure is believed to be tubular cell damage due to necrosis caused by the metabolic products of EG, which are toxic to organs such as the kidneys and, liver, lungs, while glomerular damage is minimal. The prominent histopathologic characteristic of EGcol poisoning is the presence of calcium oxalate crystals in tubules and cells in organs, accompanied by degeneration of the gastrointestinal tract. Recent studies conducted in rats showed the accumulation of oxalate, the end product of EG metabolism in organs such as the kidneys, liver, lungs, brain, and heart in the form of calcium oxalate monohydrate crystals. These crystals are internalized by proximal tubule cells, causing mitochondrial damage, cell death, and tubule necrosis (Schepers et al., 2005). The result of this study was that there were signs of hematuria in the urine sample collected from T9. Hematuria is an abnormal condition characterized by the presence of erythrocytes in the urine. The morphology of erythrocytes can be normal or abnormal, and they can originate from various locations in the urinary tract, ranging from the glomerular basement membrane to the distal urethra. Hematuria is divided into macroscopic and microscopic hematuria. If the condition of hematuria causes the color of urine to become cloudy, red, or brown, it is called macroscopic. If the hematuria does not change the color of the urine and is detected microscopically or with a urine dipstick, it is called microscopic. Kidney stones are the most common cause of hematuria, and other conditions can also cause hematuria, including urinary tract infections, kidney infections, and bladder stones (Nagendra et al., 2023). Renal tubule cell degenerationDegeneration is a cell reaction to reversible injury where there is a process of accumulation of fluid or other abnormal substances in cell organelles (Miller and Zachary 2017). Based on the results of the study, exposure to EG orally for 24 hours can cause damage to mice kidney tubule cells microscopically in the form of narrowing and closing of the proximal tubule lumen. In this study, no hyaline cast was found in the distal tubule lumen, which is also one of the criteria for kidney assessment. The occurrence of damage to the renal tubules of these mice after exposure to EG follows the theory that the process of excretion of EG that takes place in the kidneys can hurt the kidneys themselves. This is due to several factors, one of which is that although the weight of the kidneys is only about 0.5% of the total body weight, the kidneys receive blood as much as 20%–25% of the cardiac output through the renal artery. This high blood flow to the kidneys causes various drugs, chemicals, heavy metals, and toxic materials in the systemic circulation to be sent to the kidneys in large quantities. EG toxic substances will accumulate in the kidneys and cause damage to the kidneys themselves. The proximal tubule is the part that is most often damaged due to exposure to nephrotoxic substances. The predisposing factor that causes proximal tubule cells to be easily damaged is the role of the proximal tubule, which reabsorbs 60%–80% of glomerular filtration results. Other predisposing factors are the wide surface area of tubular reabsorption, the active transport system for ions and organic acids, and the ability of the tubules to concentrate substances. The active transport system for ions, organic acids, low molecular weight proteins, peptides, and heavy metals mostly occurs in the proximal tubule, causing accumulation and toxicity in the proximal tubule, which ultimately results in proximal tubule damage (Yang and Hinner 2015). The loose proximal tubular epithelium facilitates the entry of various components into the tubular cells. This is thought to be something that contributes to tubular damage. The tubular injury involves loss of the brush border in the proximal tubule towards the tubular lumen. Cell swelling or what is commonly known as albuminous degeneration (cloudy swelling) is what may cause the tubular lumen to narrow to closure, as seen in this study. Apart from causing direct tubular damage, EG also can damage the kidneys through external effects by influencing the hemodynamic system, immunological response, or metabolites of toxic substances. Some toxic substances can change intrarenal hemodynamics, triggering vasoconstriction. Prolonged vasoconstriction results in decreased perfusion pressure, decreased glomerular hydrostatic pressure, decreased GFR, and tissue hypoxia due to reduced oxygen and nutrient flow, which ultimately causes tubular damage (Basile et al., 2012). Arteriolar vasoconstriction occurs due to activation of the renin-angiotensin system as a result of disruption of Na+ and Cl transport. Vasoconstriction will cause renal tubular tissue anoxia, which starts from impaired filtration by the glomerulus, Bowman’s capsule. As a result of tissue anoxia, the supply of ATP is reduced, especially in the process of oxidative phosphorylation in mitochondria. A decrease in the supply of ATP means the role of sodium-potassium adenosine triphosphatase (Na-K ATPase) in carrying out the normal function of the sodium-potassium pump (Sodium-Potassium Pump) in pumping sodium and potassium ions in and out of cells. This causes the sodium ions to remain in the cell. Cells, while potassium ions remain outside the cells which results in the tubule cells becoming hypertonic which will attract all the fluid into the tubule cells so that the cells become swollen (cell soeling). Swollen cells are followed by all tubular cell organelles, including the Golgi apparatus, endoplasmic reticulum, lysosum, and mitochondria, this is called degenerated cells. Proximal tubular epithelial cells can repair their cells. When exposed to toxic substances, undamaged cells can compensate for the damage by hypertrophy, adaptation, and cell proliferation, followed by re-epithelialization. As with cells that are not damaged, cells that are damaged but have not experienced necrosis will carry out cell repair and adaptation. However, certain doses of toxic substances that accumulate in epithelial cells will disrupt the processes of cell repair, migration, and proliferation so that the cells cannot compensate for the damage (Miller and Zachary 2017). This is what causes the number of tubules that are damaged to increase in proportion to the increase in the length of EG exposure given. Renal tubular cell necrosisDegenerated tubule cells can be reversible, meaning they can function again as normal cells if the cause of degeneration in kidney tubule cells can be immediately removed, namely the toxic substance EG as a trigger for tubule cell degeneration, but if EG poisoning is not immediately stopped or continues continuously such as repeated use of paracetamol syrup or cough syrup which can be used 3–4 times a day, it will progress to necrosis which is characterized by the cell membrane and cell nuclear membrane breaking and becoming fragments (karyorrhexis), the cell nucleus fading or disappearing (karyolysis), and the cell nucleus becomes condensed and dark (pyknotic). Glycolic acid is similar to lactate, so it is oxidized by the enzyme glycolate oxidase or lactate dehydrogenase to become glycolic acid, glyoxylic acid, and oxalic acid. Besides being toxic, glycolic acid and glyoxalic acid are also precursors for oxalic acid, which is also toxic. Glyoxalic acid is also a precursor for the metabolites α-hydroxy- β-ketoadipic acid and glycine, which are then converted to hippuric acid. These metabolites are non-toxic. Thiamin (vitamin B1) is a cofactor in the production of α-hydroxy-β-ketoadipic acid. Pyridoxine (vitamin B6) and magnesium are cofactors in glycine production (Hrubša et al., 2022). Glycolic acid, glyoxalic acid, and oxalic acid mostly dissociate under physiological conditions and release hydrogen ions from their carboxylic acid functional group (R- COOH) (Eugene et al., 2016). Toxic metabolite compounds, namely oxalic acid, can bind to ionized calcium and form calcium oxalate crystals (Baltazar et al., 2023). Calcium oxalate (calcium oxalate monohydrate) will settle in the renal tubules and cause tubular cell necrosis. Inflammatory cell infiltration of renal tubulesInflammation is a natural defense response of living creatures to stimuli such as infectious agents, trauma, chemical and toxic substances, and physical and surgical operations. EGcol is a toxic alcohol compound that can be found in the surrounding environment. EGcol can cause intrarenal calcium oxalate deposits and cause inflammation of the kidneys. Proinflammatory cytokines are released at the start of inflammation, increasing the release of other cytokines and activating inflammatory cells. The main inflammatory cytokines in the immune response are Tumor Necrosis Factor-alpha (TNF-α), IL-1, and IL-18. TNF-α is a cytokine produced mainly by monocytes or macrophages and Kupffer cells, skin keratinocytes, brain glial cells, T lymphocytes, and B lymphocytes (Aslan et al., 2014). TNF-α is an adipokine cytokine involved in systemic inflammation that stimulates acute phase reactions. ConclusionThe LD50 for EG in male Mus musculus mice is 1,598 mg/kg body weight per day; therefore, according to the Loomis and Hayes (1996) toxicity scale, EG is a toxic compound with a “slightly toxic” toxicity level. Urine production was significantly reduced when EG was administered at doses ranging from 4.94 mg/kg BW to 1517.66 mg/kg BW, with the dose of 1517.66 mg/kg BW causing the most significant reduction. The administration of increasing dosages of EG in mice (Mus musculus) leads to heightened degeneration and necrosis of renal tubular cells. Additionally, it results in the development of inflammatory cells in the interstitium of renal tubules. AcknowledgmentsThe authors are thankful to the Universitas Airlangga for providing the necessary facilities for this study. Conflict of interestThe authors declare that there is no conflict of interest. FundingThe authors thank Universitas Airlangga for funding this study (contract No. 1282/UN3.1.6/PT/2023), Kharisma Ma’wa, Berlian Ramahanti, and Angi Saragi for technical support. Author’s contributionsDKM, IM, and WW: Conceived, designed, and coordinated the study. CAD, ERH, and NS: Designed data collections tools, supervised the field sample and data collection, and laboratory work as well as data entry. ZNAR, RR, and ARK: Validation, supervision, and formal analysis. AOA, RIM, and SWP: Contributed reagents, materials, and analysis tools. WW and RZA: Carried out the statistical analysis and interpretation and participated in the preparation of the manuscript. All authors have read, reviewed, and approved the final manuscript. Data availabilityAll of the data that support the findings of this study are available in the main text. The datasets supporting the findings of this study are available from the corresponding author upon reasonable request. ReferencesBaltazar, P., de Melo Junior, A.F., Fonseca, N.M., Lança, M.B., Faria, A., Sequeira, C.O., Teixeira-Santos, L., Monteiro, E.C., Pinheiro, L.C., Calado, J., Sousa, C., Morello, J. and Pereira, S.A. 2023. Oxalate (dys)metabolism: Person-to-Person variability, kidney and cardiometabolic toxicity. Genes (Basel) 14(9), 1719. Basile, D.P., Anderson, M.D. and Sutton, T.A. 2012. Pathophysiology of acute kidney injury. Compr. Physiol. 2(2), 1303–1353. Casarett and Doull’s. 1995. Toxicology: The Basic Science of Poisons. 5 th. ed. New York City, NY: McGraw-Hill, pp: 35–71. Dearden, J.C. and Hewitt, M. 2021. Prediction of human lethal doses and concentrations of MEIC chemicals from rodent LD50 values: an attempt to make some reparation. Atla-Altern. Lab. Anim. 49(1–2), 10–21. Erhirhie, E.O., Ihekwereme, C.P. and Ilodigwe, E.E. 2018. Advances in acute toxicity testing: strengths, weaknesses and regulatory acceptance. Interdiscip. Toxicol. 11(1), 5–12. Eugene, A.J., Xia, S.S. and Guzman, M.I. 2016. Aqueous photochemistry of glyoxylic acid. J. Phys. Chem. A. 120(21), 3817–3826. Fowles, J., Banton, M., Klapacz, J. and Shen, H. 2017. A toxicological review of the EGcol series: commonalities and differences in toxicity and modes of action. Toxicol. Lett. 278(1), 66–83. Gallagher, N. and Edwards, F.J. 2019. The diagnosis and management of toxic alcohol poisoning in the emergency department: a review article. Adv. J. Emerg. Med. 3(3), e28. Ghannoum, M., Gosselin, S., Hoffman, R.S., Lavergne, V., Mégarbane, B., Hassanian-Moghaddam, H., Rif, M., Kallab, S., Bird, S., Wood, D.M., Roberts, D.M. and EXTRIP Workgroup. 2023. Extracorporeal treatment for EGcol poisoning: systematic review and recommendations from the EXTRIP workgroup. Crit. Care 27(1), 56. Hamm, J., Allen, D., Ceger, P., Flint, T., Lowit, A., O’Dell, L., Tao, J. and Kleinstreuer, N. 2021. Performance of the GHS mixtures equation for predicting acute oral toxicity. Regul. Toxicol. Pharmacol. 125(1), 105007. Hovda, K.E., Guo, C., Austin, R. and McMartin, K.E. 2010. Renal toxicity of ethylene glycol results from internalization of calcium oxalate crystals by proximal tubule cells. Toxicol. Lett. 192(3), 365–372. Hrapkiewicz, K., Colby, L. and Denison, P. 2013. Clinical Laboratory Animal Medicine An Introduction. Fourth Edition. Hoboken, NJ: John Wiley & Sons Inc, pp: 54–60. Hrubša, M., Siatka, T., Nejmanová, I., Vopršalová, M., Krčmová, L.K., Matoušová, K., Javorská, L., Macáková, K., Mercolini, L., Remião, F., Máťuš, M., Mladěnka, P. and On Behalf Of The Oemonom. 2022. Biological properties of vitamins of the B-complex, part 1: vitamins B1, B2, B3, and B5. Nutrients 14(3), 484. Jobson, M.A., Hogan, S.L., Maxwell, C.S., Hu, Y., Hladik, G.A., Falk, R.J., Beuhler, M.C. and Pendergraft, W.F. 3rd. 2015. Clinical features of reported ethylene glycol exposures in the United States. PLoS One 10(11), e0143044. Khawar, M.B. and Sun, H. 2021. CAR-NK Cells: from natural basis to design for kill. Front. Immunol. 12(1), 707542. Klopfleisch, R. 2013. Multiparametric and semiquantitative scoring systems for the evaluation of mouse model histopathology--a systematic review. BMC Vet. Res. 9(1), 123. Loomis, T.A. and Hayes, A.W. 1996. Loomis’s essentials of toxicology. 4 th. Ed. CA: Academic Press, pp: . 208–245. Löscher, W., Ferland, R.J. and Ferraro, T.N. 2017. The relevance of inter- and intrastrain differences in mice and rats and their implications for models of seizures and epilepsy. Epilepsy Behav. 73(1), 214–235. Makris, K. and Spanou, L. 2016. Acute kidney injury: definition, pathophysiology and clinical phenotypes. Clin. Biochem. Rev. 37(2), 85–98. Marchette, R.C.N., Bicca, M.A., Santos, E.C.D.S. and de Lima, T.C.M. 2018. Distinctive stress sensitivity and anxiety-like behavior in female mice: strain differences matter. Neurobiol. Stress. 9(1), 55–63. Martinez, M.N. 2011. Factors influencing the use and interpretation of animal models in the development of parenteral drug delivery systems. AAPS J. 13(4), 632–649. Miller, M.A. and Zachary, J.F. 2017. Mechanisms and morphology of cellular injury, adaptation, and death. Pathol. Basis Vet. Dis. 2017, 2–43.e19. Nagendra, V., Dhande, R., Mishra, G., Reddy, N.G. and Gowda, H. 2023. Hematuria as a sign of kidney stone disease evaluated using computed tomography: a review. Cureus 15(4), e38064. Perazella, M.A. and Herlitz, L.C. 2021. The crystalline nephropathies. Kidney Int. Rep. 6(12), 2942–2957. Porter, W.H. 2012. Ethylene glycol poisoning: quintessential clinical toxicology; analytical conundrum. Clin. Chim. Acta 413(3–4), 365–377. Reed, L.J. and Muench. 1938. A simple method of estimating fifty present and points. Am. J. Hyg. 27: 493–497. Rhee, E.P. 2018. A systems-level view of renal metabolomics. Semin. Nephrol. 38(2). 142–150. Schepers, M.S., van Ballegooijen, E.S., Bangma, C.H. and Verkoelen, C.F. 2005. Crystals cause acute necrotic cell death in renal proximal tubule cells, but not in collecting tubule cells. Kidney Int. 68(4), 1543–1553. Song, C.H., Bae, H.J., Ham, Y.R., Na, K.R., Lee, K.W. and Choi, D.E. 2017. A case of ethylene glycol intoxication with acute renal injury: successful recovery by fomepizole and renal replacement therapy. Electrolyte Blood Press 15(2), 47–51. Spurgeon, D., Lahive, E., Robinson, A., Short, S. and Kille, P. 2020. Species sensitivity to toxicological substances: evolution, ecology, and applications. Front. Environ. Sci. 8(1), 588380. Tanasescu, A., Macovei, R.A. and Tudosie, M.S. 2014. Outcome of patients in acute poisoning with ethylene glycol--factors which may have influence on evolution. J. Med. Life. 7(Spec Iss 3), 81–86. van Leent, A., Huntjens, D.W., Hamulyák, E.N., Franssen, E.J.F., de Fijter, C.W.H. and Bosman, R.J. 2024. Ethylene glycol intoxication: mind your gap(s)!—a case report. J. Emerg. Crit. Care Med. 8(1), 13. Van Norman, G.A. 2019. Limitations of animal studies for predicting toxicity in clinical trials: is it time to rethink our current approach? JACC Basic Transl. Sci. 4(7), 845–854. Wang, Y., Ning, Z.H., Tai, H.W., Long, S., Qin, W.C., Su, L.M. and Zhao, Y.H. 2015. Relationship between lethal toxicity in oral administration and injection to mice: effect of exposure routes. Regul. Toxicol. Pharmacol. 71(2), 205–212. Webb and Craig, B. 2020. Ethylene glycol toxicity. The Veterinary ICU Book. Boca Raton, FL: CRC Press, pp: 1042–1048. Yang, N.J. and Hinner, M.J. 2015. Getting across the cell membrane: an overview for small molecules, peptides, and proteins. Methods Mol. Biol. 1266(1), 29–53. | ||
| How to Cite this Article |
| Pubmed Style Meles DK, Mustofa I, Wurlina W, Donova CA, Hidayanti ER, Suwasanti N, Rosyada ZNA, Khairullah AR, Akintunde AO, Mustofa RI, Putra SW, Ahmad RZ, Wasito W, Raissa R. Acute toxicity effects of ethylene glycol on lethal dose 50 (LD50), urine production, and histopathology change renal tubule cell in mice. Open Vet. J.. 2024; 14(12): 3539-3551. doi:10.5455/OVJ.2024.v14.i12.36 Web Style Meles DK, Mustofa I, Wurlina W, Donova CA, Hidayanti ER, Suwasanti N, Rosyada ZNA, Khairullah AR, Akintunde AO, Mustofa RI, Putra SW, Ahmad RZ, Wasito W, Raissa R. Acute toxicity effects of ethylene glycol on lethal dose 50 (LD50), urine production, and histopathology change renal tubule cell in mice. https://www.openveterinaryjournal.com/?mno=224812 [Access: January 25, 2026]. doi:10.5455/OVJ.2024.v14.i12.36 AMA (American Medical Association) Style Meles DK, Mustofa I, Wurlina W, Donova CA, Hidayanti ER, Suwasanti N, Rosyada ZNA, Khairullah AR, Akintunde AO, Mustofa RI, Putra SW, Ahmad RZ, Wasito W, Raissa R. Acute toxicity effects of ethylene glycol on lethal dose 50 (LD50), urine production, and histopathology change renal tubule cell in mice. Open Vet. J.. 2024; 14(12): 3539-3551. doi:10.5455/OVJ.2024.v14.i12.36 Vancouver/ICMJE Style Meles DK, Mustofa I, Wurlina W, Donova CA, Hidayanti ER, Suwasanti N, Rosyada ZNA, Khairullah AR, Akintunde AO, Mustofa RI, Putra SW, Ahmad RZ, Wasito W, Raissa R. Acute toxicity effects of ethylene glycol on lethal dose 50 (LD50), urine production, and histopathology change renal tubule cell in mice. Open Vet. J.. (2024), [cited January 25, 2026]; 14(12): 3539-3551. doi:10.5455/OVJ.2024.v14.i12.36 Harvard Style Meles, D. K., Mustofa, . I., Wurlina, . W., Donova, . C. A., Hidayanti, . E. R., Suwasanti, . N., Rosyada, . Z. N. A., Khairullah, . A. R., Akintunde, . A. O., Mustofa, . R. I., Putra, . S. W., Ahmad, . R. Z., Wasito, . W. & Raissa, . R. (2024) Acute toxicity effects of ethylene glycol on lethal dose 50 (LD50), urine production, and histopathology change renal tubule cell in mice. Open Vet. J., 14 (12), 3539-3551. doi:10.5455/OVJ.2024.v14.i12.36 Turabian Style Meles, Dewa Ketut, Imam Mustofa, Wurlina Wurlina, Clarissa Audreylea Donova, Essi Rayareswari Hidayanti, Niluh Suwasanti, Zulfi Nur Amrina Rosyada, Aswin Rafif Khairullah, Adeyinka Oye Akintunde, Rheza Imawan Mustofa, Satriawan Wedniyanto Putra, Riza Zainuddin Ahmad, Wasito Wasito, and Ricadonna Raissa. 2024. Acute toxicity effects of ethylene glycol on lethal dose 50 (LD50), urine production, and histopathology change renal tubule cell in mice. Open Veterinary Journal, 14 (12), 3539-3551. doi:10.5455/OVJ.2024.v14.i12.36 Chicago Style Meles, Dewa Ketut, Imam Mustofa, Wurlina Wurlina, Clarissa Audreylea Donova, Essi Rayareswari Hidayanti, Niluh Suwasanti, Zulfi Nur Amrina Rosyada, Aswin Rafif Khairullah, Adeyinka Oye Akintunde, Rheza Imawan Mustofa, Satriawan Wedniyanto Putra, Riza Zainuddin Ahmad, Wasito Wasito, and Ricadonna Raissa. "Acute toxicity effects of ethylene glycol on lethal dose 50 (LD50), urine production, and histopathology change renal tubule cell in mice." Open Veterinary Journal 14 (2024), 3539-3551. doi:10.5455/OVJ.2024.v14.i12.36 MLA (The Modern Language Association) Style Meles, Dewa Ketut, Imam Mustofa, Wurlina Wurlina, Clarissa Audreylea Donova, Essi Rayareswari Hidayanti, Niluh Suwasanti, Zulfi Nur Amrina Rosyada, Aswin Rafif Khairullah, Adeyinka Oye Akintunde, Rheza Imawan Mustofa, Satriawan Wedniyanto Putra, Riza Zainuddin Ahmad, Wasito Wasito, and Ricadonna Raissa. "Acute toxicity effects of ethylene glycol on lethal dose 50 (LD50), urine production, and histopathology change renal tubule cell in mice." Open Veterinary Journal 14.12 (2024), 3539-3551. Print. doi:10.5455/OVJ.2024.v14.i12.36 APA (American Psychological Association) Style Meles, D. K., Mustofa, . I., Wurlina, . W., Donova, . C. A., Hidayanti, . E. R., Suwasanti, . N., Rosyada, . Z. N. A., Khairullah, . A. R., Akintunde, . A. O., Mustofa, . R. I., Putra, . S. W., Ahmad, . R. Z., Wasito, . W. & Raissa, . R. (2024) Acute toxicity effects of ethylene glycol on lethal dose 50 (LD50), urine production, and histopathology change renal tubule cell in mice. Open Veterinary Journal, 14 (12), 3539-3551. doi:10.5455/OVJ.2024.v14.i12.36 |

