


| Research Article | ||
Open Vet. J.. 2024; 14(5): 1182-1190 Open Veterinary Journal, (2024), Vol. 14(5): 1182–1190 Research Article Differences in normal nasal computed tomography findings in different dog breedsKodai Tashiro1, Kazuya Kushida2, Shunsuke Miyahara3, Aritada Yoshimura3, Shoma Sugi1, Mizuki Tamazawa1, Eisei Shimizu1, Miu Matsumoto1, Toshie Iseri2, Miki Shimizu1, Ryuji Fukushima2 and Miori Kishimoto1*1Cooperative Department of Veterinary Medicine, Tokyo University of Agriculture and Technology, Fuchu, Japan 2Koganei Animal Medical Emergency Center, Tokyo University of Agriculture and Technology, Koganei, Japan 3Animal Medical Center, Tokyo University of Agriculture and Technology, Fuchu, Japan *Corresponding Author: Miori Kishimoto. Cooperative Department of Veterinary Medicine, Tokyo University of Agriculture and Technology, Fuchu, Japan. Email: miori [at] cc.tuat.ac.jp Submitted: 03/02/2024 Accepted: 06/04/2024 Published: 31/05/2024 © 2024 Open Veterinary Journal
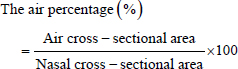
AbstractBackground: Computed tomography (CT) is the gold standard for diagnosing canine nasal diseases. However, it cannot easily detect minor abnormalities in inflammatory diseases because they are not accompanied by obvious morphological changes. Aim: The present study aimed to compare the differences in normal CT findings of turbinate structure and mucosa between breeds to establish criteria for CT diagnosis of inflammatory diseases of the nasal cavity. Methods: CT data from 77 dogs of 5 breeds without nasal diseases were retrospectively studied. The nasal air percentage, which reflects the volume of the nasal turbinate structure and mucosa, was measured. The nasal turbinate mucosa was measured for contrast enhancement reflecting blood flow. Measurements were performed in the ventral and ethmoid turbinate (ET) regions. Comparisons were made between breeds and sections. Results: The air percentage in the ventral and ET regions was significantly different between breeds. Contrast enhancement was significantly different between breeds only in the ET. Moreover, different breeds had different correlations between body weight, age, nose length, and air percentage. Conclusion: In this study, reference values for normal CT findings of the nasal structure and mucosa were obtained, taking into account the breed, measurement section, and patient factors. The results showed that the volume of the turbinate structure and contrast enhancement of nasal mucosa differed depending on the breed. The measured values also differed depending on the cross-sections and patient factors. Keywords: Computed tomography, Dog, Nasal inflammatory disease, Turbinate structure, Turbinate mucosa. IntroductionComputed tomography (CT) is the gold standard for diagnosing canine nasal diseases (Kuehn, 2006). It can diagnose nasal diseases by identifying mass and bone destruction (Lefebvre et al., 2005). However, some nasal inflammatory diseases (e.g., lymphoplasmacytic rhinitis) do not cause obvious morphological changes (Lefebvre et al., 2005). In this case, CT cannot easily detect abnormal changes in nasal structures. Several factors influence the detection of minor abnormalities in the nasal cavity on CT examination; one is the breed difference. Each breed has different nasal shapes and structures including the turbinate. Moreover, the nasal structures on each section of the CT scan differ based on nose length. Another factor is the lack of a standardized normal turbinate structure and mucosa. For example, turbinate destruction and swelling of the turbinate mucosa caused by inflammatory diseases change the turbinate volume and thickness and contrast enhancement of turbinate mucosa. Moreover, there are no criteria to identify these changes. Another factor is patient-related factors such as age and individual differences. Unlike the human nasal mucosa (Loftus et al., 2016), it is unclear whether the canine nasal mucosa shrinks with aging. Furthermore, although body weight, nose length, and degree of nasal septum deviation differ depending on individuals (Miles and Schwarz, 2020), it remains unknown whether the turbinate structure and mucosa change according to individual differences. This study aimed to compare differences in normal CT findings of turbinate structure and mucosa between breeds and to investigate their normal changes considering patient-related factors to identify minor abnormalities of canine nasal structures in CT scans. Materials and MethodsThe CT images of 77 dogs recorded at the Tokyo University of Agriculture and Technology Animal Medical Center between 2018 and 2022 were retrospectively studied. The CT images of dogs including the cranial nasal edge and those without a past and current medical history of nasal diseases, dental diseases, and nasal pathological morphological abnormalities were extracted. Five different breeds were represented: 16 Miniature dachshunds [median age=133.0 months (range 84.5–160.5), median body weight=5.2 kg (range 4.7–5.9)], 16 Toy poodles [median age=127.0 months (range 77.0–148.0), median body weight=3.8 kg (range 2.9–5.1)], 15 Shibas [median age=131.0 months (range 95.5–160.0), median body weight=10.9 kg (range 7.6–13.0)], 15 Chihuahuas [median age=131.0 months (range 84.5–152.0), median body weight=2.8 kg (range 2.5–4.0)], and 15 Shih tzus [median age=137.0 months (range 118.5–159.5), median body weight=6.4 kg (range 5.7–7.3)]. All CT scans were performed with a 64-slice multidetector-row CT (Aquilion CXL, Canon Medical Systems, Tochigi, Japan) under general anesthesia. The scanning conditions were as follows: tube voltage=120 kVp, tube current=automatic exposure control (SD 10), and slice thickness=0.5 mm. Turbinate destruction is one of the structural changes caused by nasal inflammatory diseases (Saunders et al., 2003). Therefore, a decrease in nasal turbinate volume can be determined by measuring the turbinate area on transverse CT sections. However, the nasal turbinate structure is so complicated that it is clinically difficult to measure that area by tracing the turbinate’s outline on CT images. Although histogram analysis using CT values enables to measurement of the area within the threshold, they lack objectivity because the CT values of the nasal turbinate are not constant. Thus, spaces not including the nasal turbinate (i.e., nasal air area, which reflects the nasal turbinate area) were focused. Additionally, using a histogram for nasal air area measurement is easy because the threshold of air CT values is simple to set. The measurement was performed on four transverse sections of the ventral and ethmoid turbinate (ET) area. Cross-sections where landmarks can be easily set were used to ensure repeatability. Three ventral turbinate areas were measured: the level of the cranial edge of the first maxillary molars (VT1), middle level between VT1 and VT3 (VT2), and the level of the cranial edge of the third maxillary molars (VT3). The ET area was measured at the level of the widest maxillary recess (ET). CT images reconstructed with bone function were used. The window configurations were as follows: window width 1,500 and window level −300. The threshold of air CT values was ≤600 HU. First, the cross-sections of the nasal cavity for VT1, VT2, VT3, and ET were selected semi-manually using the area measurement function of the workstation and defined as the regions of interest (ROIs). The nasal area was defined as the ROI area. Second, the area of the ROI with air CT value ≤600 HU was measured by histogram analysis. The air percentage in four transverse sections was calculated using the nasal and air cross-sectional area:
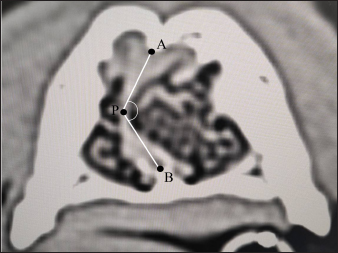
Then, the contrast enhancement of nasal turbinate mucosa was calculated. Among the data of dogs for calculating the air percentage, the data of 66 dogs were used (Of the total of 77 dogs, 11 were excluded because their post-contrast images did not include the entire nasal cavity.). Five different breeds were represented: 13 Miniature dachshunds [median age=153.0 months (range 127.0–168.5), median body weight=5.2 kg (range 4.7–5.5)], 12 Toy poodles [median age=127.0 months (range 93.5–148.0), median body weight=3.6 kg (range 2.9–4.2)], 14 Shibas [median age=126.5 months (range 92.8–154.3), median body weight=10.9 kg (range 7.9–13.0)], 12 Chihuahuas [median age=135.0 months (range 89.8–157.3), median body weight=2.8 kg (range 2.5–4.1)], and 15 Shih tzus [median age=137.0 months (range 118.5–159.5), median body weight=6.4 kg (range 5.7–7.3)]. All contrast-enhanced CT images were examined on multiphase with a 30 s fixed injection method using 600 mg/kg of iodixanol (Visipaque 320, GE Healthcare Pharma, Tokyo, Japan). The contrast enhancement of nasal turbinate mucosa was calculated at VT2 (the level of ventral turbinate) and ET (the level of ET). VT2 was selected as the level of ventral turbinate because it was a transverse section including the most area of the ventral turbinate. The CT images reconstructed with soft-tissue function were used for calculating contrast enhancement. The window configurations were as follows: window width 1,200 and window level −200. First, the nasal area in the pre-contrast CT images of VT2 and ET was manually traced by the workstation’s area measuring function. The ROI was set on the right and left nasal areas separately to exclude nasal septal mucosa, and the average CT values of the right and left ROIs were defined as the nasal CT values. Furthermore, both ROIs were separately copied on post-contrast CT images (venous phase), and the nasal CT values were measured in the same way. Finally, the contrast enhancement of nasal turbinate mucosa was defined as the difference between the pre-contrast and post-contrast nasal CT values. Nasal septum deviation is one of the normal anatomical individual differences (Miles and Schwarz, 2020). The air percentage and contrast enhancement of nasal mucosa in the right and left nasal cavities can change when the nasal septum deviation concentrates nasal structures either on the right or left nasal cavity. In other words, it is difficult to determine whether the changes in patients with nasal septum deviation are caused by nasal inflammation or simple individual differences. Therefore, this study examined the right–left ratio of the air percentage and contrast enhancement in normal dogs with remarkable nasal septum deviation. Chihuahuas and Shih tzus were considered because nasal septum deviation can be easily found in these breeds compared with Miniature dachshunds, Toy poodles, and Shibas. However, since there are no distinct criteria regarding the presence and degree of nasal septum deviation, a standard indicating that “nasal septum deviation is remarkable” was needed in Chihuahuas and Shih tzus. Thus, after measuring the angle of nasal septum deviation in both breeds, dogs whose minor angle sides of nasal septum deviation were median value or less were selected. Based on previous studies (Auger et al., 2016; Miles and Schwarz, 2020), the degree of nasal septum deviation was defined as ∠APB, where (A) is the dorsal point of the nasal septum; (P) is the most deviated point of the nasal septum; and (B) is the ventral point of the nasal septum, which is the binding site of the nasal septum and vomer (Fig. 1). Regarding each dog, transverse sections on which the degree of nasal septum deviation was visually the largest were selected for ∠APB measurement. The CT images reconstructed with bone function were used for measuring ∠APB. The window configurations were as follows: window width 1,500 and window level −300. After measurement, the air percentage was analyzed in eight Chihuahuas and eight Shih tzus whose ∠APB values were median values or less. Since the direction of nasal septum deviation was not always similar, the right and left nasal areas were defined as the major and minor angle sides. After calculating the air percentage on the major and minor angle sides using the method mentioned above, the proportion of the air percentage on the minor angle side to that on the major angle side was calculated. In addition, differences in contrast enhancement were analyzed. However, the post-contrast CT images were not obtained in three Chihuahuas. Therefore, the CT images of six Chihuahuas and eight Shih tzus whose ∠APB values were median value or less were selected. After calculating the contrast enhancement on the major and minor angle sides using the method mentioned above, the proportion of contrast enhancement on the minor angle side to that on the major angle side was calculated.
Fig. 1. CT measurements for ∠APB at the maximum level of nasal septum deviation (axial section). A: the dorsal, B: the ventral, and P: the most deviated point of the nasal septum window width: 1,500, window level: −300. Next, individual differences in nose length were investigated. Different breeds have different nose lengths. In addition, the nasal structure can vary based on the skeletal structure. Thus, the nose length was calculated in this study, and the correlation between nose length and air percentage or contrast enhancement was examined in each breed. Two methods were used to calculate the nose length. One is the facial index (FI), a kind of cephalic index (Andreis et al., 2018; Miles and Schwarz, 2020). Although actual measurement values obtained from a skeletal specimen are originally used in this method, this study used , which resulted from measuring distances at equal parts after identifying those parts on CT images. was calculated as follows:
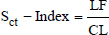
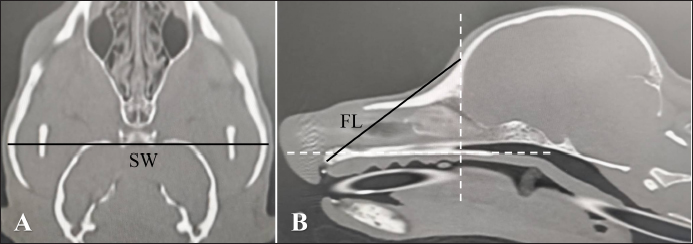
where skull width (SW) is the length between the most lateral points of the zygomatic arch (dorsal section, Fig. 2A) and FL is the length between the nasion and the prosthion (sagittal section, Fig. 2B). Another method is the skull index (S-index) (Koch et al., 2012). The S-index uses the distance between the prosthesis and the cranial edge of the olfactory bulb and the distance between the cranial edge of the olfactory bulb and the inion on the X-ray dorsoventral image to express the length of the nose in the cranium. The X-ray image is a transparency image, so these three points appear on the same image and are therefore easy to measure. However, in CT dorsal images, which are similar to X-ray dorsal images, these three points cannot be simultaneously displayed in the same cross-section. Therefore, each distance has to be measured in a different cross-section. Since these processes were complicated, this study used the -Index, which resulted from measuring distances at equal parts after identifying those points on CT images. The -Index was calculated as follows:
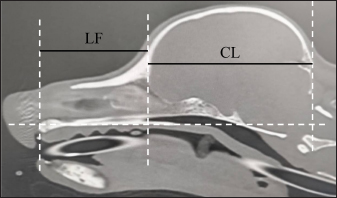
where length of the facial skull (LF) is the length between the nasion and the cranial edge of the olfactory bulb horizontal to the hard plate and cranial length (CL) is the length between the cranial edge of the olfactory bulb and inion horizontal to the hard plate (Fig. 3). The CT images reconstructed with bone function were used to calculate and -Index. The window configurations were as follows: window width 5,000 and window level 1,000. All measurements were performed with an image processing workstation (Virtual Place Fujin, Canon Medical Systems).
Fig. 2. A and B. CT measurements for FIct. A: SW: the length between the most lateral points of the zygomatic arch (dorsal section). B: FL: the length between the nasion and the prosthion (sagittal section). Window width: 5,000, window level: 1,000.
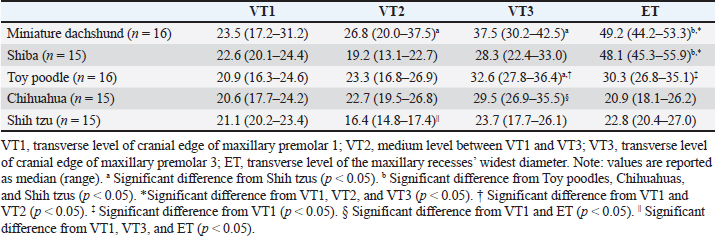
Fig. 3. CT measurements for Sct-Index (sagittal section). LF: the length between the nasion and the cranial edge of the olfactory bulb horizontal to the hard plate. CL: the length between the cranial edge of the olfactory bulb and the inion horizontal to the hard plate. Window width: 5,000, window level: 1,000. All statistical analyses were performed using SPSS (version 25.0, SPSS Inc, Chicago, IL). Significance tests on the air percentage and contrast enhancement were performed among breeds, transverse sections, and between the major angle side and the minor angle side. The Mann–Whitney’s U test was used to determine whether two groups were significantly different, whereas the Kruskal–Wallis test or Bonferroni/Dunn test was used to determine whether more than three groups were significantly different. Regarding age, body weight, , and -Index, and correlation coefficient tests were performed to determine the correlation between the air percentage and contrast enhancement in each breed. Furthermore, these tests were performed between ∠APB and the proportion of the air percentage on the minor angle side to that on the major angle side and between ∠APB and the proportion of the contrast enhancement on the minor angle side to that on the major angle side. Spearman’s rank correlation coefficient was used for correlation coefficient tests. The level of statistical significance for all tests was set at 0.05. ResultsTable 1 shows the results of the air percentage on each transverse section of each breed. At VT1, no significant difference in the air percentage was observed among all breeds. At VT2 and VT3, the air percentage was significantly larger in Miniature dachshunds than in Shih tzus. Moreover, at VT3, the air percentage was significantly larger in Toy poodles than in Shih tzus. At ET, the air percentage was significantly larger in Miniature dachshunds than in Toy poodles, Chihuahuas, and Shih tzus. In addition, at ET, the air percentage was significantly larger in Shibas than in Toy poodles, Chihuahuas, and Shih tzus, respectively. The air percentage among transverse sections in each breed was compared. In Miniature dachshunds and Shibas, the air percentage was significantly larger at ET than at VT1, VT2, and VT3. In Toy poodles, the air percentage was significantly larger at VT3 than at VT1 and VT2. Furthermore, the air percentage was significantly smaller at VT1 than at ET. In Chihuahuas, the air percentage was significantly larger at VT3 than at VT1 and ET. In Shih tzus, the air percentage was significantly smaller at VT2 than at VT1, VT3, and ET. In Miniature dachshunds, there was no correlation between the air percentage on all transverse sections and body weight, age, and Sct-Index. However, a negative correlation was observed between FIct and the air percentage at VT2 and ET (r=−0.52, r=−0.59, p < 0.05). In Shibas, there was no correlation between air percentage and body weight, age, FIct, and Sct-Index. In Toy poodles, a negative correlation was observed between the air percentage at VT3 and age (r=−0.52, p < 0.05). Moreover, there was no correlation between the air percentage on all transverse sections and age. A negative correlation was observed between the air percentage at ET and FIct (r=−0.59, p < 0.05). Furthermore, a positive correlation was observed between the air percentage at ET and Sct-Index (r=0.67, p < 0.01). In Chihuahuas, there was no correlation between the air percentage on all transverse sections and body weight, age, FIct, and Sct-Index. In Shih tzus, there was no correlation between the air percentage on all transverse sections and body weight. However, a positive correlation was observed between the air percentage at ET and age (r=0.62, p < 0.05) and Sct-Index (r=0.71, p < 0.01). Table 1. Comparison of air percentage (%) among breeds and transverse sections.
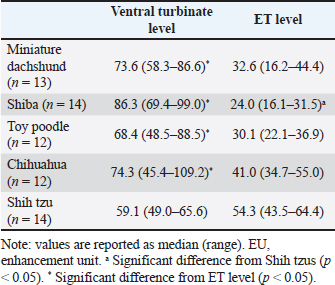
Table 2. Comparison of contrast enhancement among breeds and transverse sections (EU).
Table 2 shows the results of the contrast enhancement on the level of ventral and ET of each breed. In the contrast enhancement on the level of ventral turbinate, there was no significant difference among all breeds. However, in the contrast enhancement on the level of ET, a significant difference was observed between Shih tzus and Shibas, and the contrast enhancement was significantly larger in Shih tzus than in Shibas. In Miniature dachshunds, Shibas, Toy poodles, and Chihuahuas, the contrast enhancement on the level of ventral turbinate was significantly larger than that on the level of ET. Conversely, in Shih tzus, there was no significant difference between the contrast enhancement on the level of the ventral turbinate and that on the level of the ET. In Miniature dachshunds, Shibas, Toy poodles, and Chihuahuas, there was no significant correlation between the contrast enhancement of turbinate mucosa and body weight, age, FIct, and Sct-Index. However, in Shih tzus, a positive correlation was observed between the contrast enhancement on the level of ventral turbinate and FIct (r=0.54, p < 0.05). Furthermore, a negative correlation was observed between the contrast enhancement on the level of ET and Sct-Index (r=−0.63, p < 0.05). There was no significant difference in the proportion of the air percentage on the minor angle side to that on the major angle side and the proportion of contrast enhancement on the minor angle side to that on the major angle side between Chihuahuas and Shih tzus. In addition, there was no significant difference between the air percentage on the major angle side and that on the minor angle side and between the contrast enhancement on the major angle side and that on the minor angle side. Furthermore, no significant correlation was observed between the degree of nasal septum deviation and the proportion of the air percentage or that of contrast enhancement. DiscussionTurbinate destruction is an abnormal change of turbinate structures caused by nasal tumors and inflammatory diseases (Saunders et al., 2003). Nasal tumors destroy the nasal turbinate remarkably (Lefebvre et al., 2005); thus, they can be easily identified on CT examination. Alternatively, most nasal inflammatory diseases including lymphoplasmacytic rhinitis do not destroy the nasal turbinate significantly (Lefebvre et al., 2005); thus, identifying nasal inflammatory diseases on CT is difficult. Turbinate destruction results in decreased turbinate volume, thereby increasing the air percentage. Moreover, inflammation and swelling of nasal turbinate mucosa can lead to decreased air percentage resulting from the increased volume of nasal mucosa. Therefore, detecting decreased air percentage can be used to determine a slight increase in nasal mucosa volume and the degree of nasal turbinate destruction caused by nasal inflammatory diseases on CT. However, as revealed in this study, caution should be taken regarding the measurement and clinical application of the air percentage. In this study, the air percentage was calculated on CT transverse sections in the ventral turbinate (VT1, VT2, and VT3) and ET regions by using CT images of dogs without nasal diseases. As a result, there was no significant difference in the air percentage at VT1 among breeds, whereas a significant difference was observed in the air percentage at VT2, VT3, and ET among breeds. Moreover, significant differences in the air percentage among transverse sections were observed in all breeds. However, these differences showed no regularity. Thus, these findings suggest that a reference value of the nasal air percentage should be determined in each breed and transverse section. Furthermore, the air percentage was calculated only on four transverse sections in this study. This is because the transverse sections for measuring the air percentage do not change depending on breed and because these sections are set to reflect clear landmarks. However, in clinical patients, nasal lesions do not always appear on these four sections. Therefore, future studies should calculate the air percentage not only on each transverse section but also per unit volume. At the same time, this study suggests that patient-related factors including nose length, age, and body weight should be considered to evaluate the air percentage. First, a significant correlation was observed between the air percentage and nasal length index (FIct and Sct-Index) in three breeds. In Miniature dachshunds, a negative correlation was observed between FIct and the air percentage at VT2 and ET. In Toy poodles, a negative correlation was observed between FIct and the air percentage at ET. Moreover, in Miniature dachshunds and Shih tzus, a positive correlation was observed between the Sct-Index and the air percentage at ET. These results suggest that dogs with shorter noses have less air percentage in the nasal cavity. A previous study reported that a brachycephalic dog with a shorter nose had undeveloped nasal turbinate structures (Wagner and Ruf, 2021). Underdevelopment of the nasal turbinate structure is associated with a decrease in the volume of the turbinate in the nasal cavity, i.e., a larger air proportion. In the present study, it can be stated that in Shih Tzus, the shorter the nose, the larger the air fraction of the ET, as previously reported. However, the present study may newly suggest that the shorter the nose, the more underdeveloped the nasal carinae structure may be, not only in brachycephalic species, but also in dolichocephalic and mesaticephalic species. Nevertheless, with regard to setting a normal reference value of the air percentage and clinically evaluating the air percentage, differences should be considered in each breed (e.g., nose length). Second, this study revealed that variations in the air percentage may be related to age. A positive correlation was observed between age and the air percentage only in Shih tzus. A previous study observed a positive correlation between age and nasal cavity volume in humans (Loftus et al., 2016). One factor that contributes to this correlation is the atrophy of nasal turbinate mucosa with aging. Although this finding was only observed in one breed, age may be a kind of factor to set a normal reference value of and evaluating the air percentage. Finally, the influence of body weight on the air percentage needs to be considered. This study observed a negative correlation between body weight and the air percentage at VT3 only in Toy poodles. In mice and dogs, a previous study observed a positive correlation between body weight and the surface area of nasal turbinate (Coppola et al., 2014; van Valkenburgh et al., 2014). Thus, heavier dogs may have more complicated turbinate structures and less air percentage in the nasal cavity. However, it is unclear what a heavy body weight indicates (for example good physique, or obesity). In this study, physique and fat volume were not taken into account. Thus, further studies are needed to analyze the influence of body weight on air percentage. As described previously, turbinate destruction and increased nasal mucosa thickness resulting from mucosal edema can be identified by evaluating the air percentage using CT images. In addition, the contrast enhancement of nasal mucosa can reflect the pathology of mild inflammatory diseases. This is because an increase in vascular flow caused by inflammation of nasal turbinate mucosa increases the contrast enhancement of nasal turbinate mucosa. This study calculated the contrast enhancement of turbinate mucosa on the level of ventral and ET using CT images of dogs without clinical nasal diseases. Although no significant difference in the contrast enhancement at the level of ventral turbinate was observed among breeds, a significant difference in the contrast enhancement at the level of ET was observed between Shibas and Shih tzus, with the latter showing a significantly larger enhancement. Thus, a reference value at the level of ET of each breed is needed. Moreover, in Miniature dachshunds, Shibas, Toy poodles, and Chihuahuas, the contrast enhancement at the level of ventral turbinate was significantly larger than that at the level of ET. However, there was no significant difference between the two contrast enhancements in Shih tzus. These results suggest that a reference value should be established in the ventral and ET regions. Among all breeds, Shih tzus had the lowest contrast enhancement of ventral turbinate although no significant differences were observed. Shih tzus had the highest contrast enhancement of ET. In addition, only Shih tzus showed no significant difference between the contrast enhancement of the level of ventral turbinate and that of the level of ET (Table 2). Moreover, based on the results of the air percentage, Shih tzus is one canine group that has a relatively smaller air percentage in the nasal region of ventral and ET (Table 1). In other words, Shih tzus have the following features in the nasal region of ventral and ET: dense turbinate structure, low contrast enhancement at the level of the ventral turbinate, high contrast enhancement at the level of ET, and no significant difference between the two contrast enhancements. These results contradict the anatomical findings in other canines. While dogs histologically develop venous sinuses in the ventral turbinate mucosa, they do not have venous sinuses in the ET mucosa (Craven et al., 2007; Wagner and Ruf, 2021). These veins adjust the temperature and moisture of inflowing air. Thus, the results in this study, where the contrast enhancement of the level of ventral turbinate was significantly larger than that of the level of ET in all breeds except for Shih tzus, do not contradict this histological characteristic. Furthermore, assuming that Shih tzus have dense ventral turbinate, the vascular bed area and contrast enhancement are expected to become large and high, respectively. However, the contrast enhancement at the level of ventral turbinate was low although it showed no significant difference among breeds. Moreover, the contrast enhancement at the level of ET showed no significant difference. These results imply that Shih tzus have more undeveloped blood vessels at the level of ventral turbinate compared with other breeds. Moreover, the structure at the level of ET facilitates the attachment of olfactory substances to ET mucosa by circulating air within the ET region (Craven et al., 2010; Lawson et al., 2012). Therefore, it is possible that the ET structure in Shih tzus (which is small, preventing the nasal air flow) does not have enough olfactory function. In short, Shih tzus may have an undeveloped nasal structure, and differences at the level of ventral turbinate and ET remain unclear. In addition, contrast enhancement can change with vascular conditions (presence or absence, dilatation or constriction). Thus, the contrast enhancement in the ventral turbinate region, which has plenty of blood vessels, may vary according to blood flow changes caused by vasodilating or vasoconstrictive drugs and hyperthermia or hypothermia. These changes are possibly more remarkable in all four breeds except for Shih tzus. Aside from the air percentage, contrast enhancement was affected by different dog breeds. However, this effect was not as significant as that of the air percentage. No significant correlation was observed between the contrast enhancement of turbinate mucosa and body weight or age in all breeds. Conversely, a positive correlation was observed between the contrast enhancement at the level of ventral turbinate and FIct only in Shih tzus. Moreover, a negative correlation was observed between the contrast enhancement at the level of ET and Sct-Index. Because the results differ depending on how nose length was measured (FIct or Sct-Index), contrast enhancement may be larger in a dog with a shorter nose at the level of ventral and ET. This study showed that contrast enhancement was correlated with nose length only in Shih tzus. However, if the contrast enhancement changes with the nose length of each dog within the same breed, more complicated consideration is needed to standardize the contrast enhancement values. The contrast enhancement values of turbinate mucosa in this study are different from those in a previous study (Friling et al., 2014). This difference is attributed to different breeds, ages, body weights, measurements, and contrast-enhanced CT procedures. Particularly, the contrast-enhanced CT procedures in this study are different from those used in a previous study in terms of CT scan timing after injection of contrast medium. These conditions need to be unified to standardize the normal contrast enhancement values. In Chihuahuas and Shih tzus, the influences of the degree of nasal septum deviation, known as a normal difference of each dog, on the air percentage and contrast enhancement were also investigated. The results showed no significant difference between the air percentage and contrast enhancement on the major angle side and minor angle side in both breeds. Moreover, no significant correlation was observed between the angle of nasal septum deviation and the proportion of the air percentage and contrast enhancement on the minor angle side to that on the major angle side. Considering these results, the degree of nasal septum deviation may be not a significant factor that changes the air percentage and contrast enhancement. This study has some limitations. First, the definition of “nasal cavity is normal” is derived from a clinical viewpoint. Although this study selected dogs without clinical symptoms based on CT scans, it remains unclear whether they had no diseases based on pathological examinations and subjective symptoms. Furthermore, since only normal dogs were selected, the cut-off values were not calculated although the air percentage and contrast enhancement values were obtained. Moreover, only small- or medium-sized dogs were included in this study, and the number of dogs of each breed was small. In the future, studies with a larger population of dogs and comparisons between healthy and unhealthy dogs should be performed. Second, there are some problems with the measurements. One is the definition of transverse sections. Transverse sections on CT images are needed to measure the air percentage and contrast enhancement. However, this definition changes according to a patient’s position in a CT scan. Thus, these measurements should be performed using a unified three-dimensional section generated by multiplanar reconstruction. In this study, we defined “a transverse section” as a section vertical to the hard plate. The second problem is the window configuration observing CT images. Visual information of an observer is essential to find landmarks in deciding the measurement sections and setting the ROI in calculating contrast enhancement. Therefore, regarding inter-institutional research, the window configurations need to be unified. The third problem is the definition of the CT value of air. This study used histogram analyses to calculate the air percentage. In these analyses, the air CT value was defined as ≤600 HU. Thus, changing this definition leads to different results. The final limitation is related to the resolution and artifact. In many cases, a CT device for humans is used in the CT examination for dogs. Therefore, it is difficult to obtain high-quality images when visualizing the nasal cavity of dogs, which have smaller sizes than humans. A large field of view and low image quality due to improper multiplanar reconstruction can make the measurements difficult. Furthermore, the influences of artifacts on measurements in the nasal cavity, which is narrow and surrounded by bones, should be considered. ConclusionThis study showed the reference findings of normal turbinate structure and mucosa in CT scans, considering breeds, transverse sections, and patient-related factors. The volume of turbinate structure and contrast enhancement of turbinate mucosa varied depending on breeds, transverse sections, and patient-related factors. Thus, “normal criteria” in the nasal cavity with respect to each breed are needed to detect minor pathological changes in the nasal structure in a CT scan. AcknowledgmentsNone. Conflict of interestThe authors declare that there are no conflicts of interest. FundingThis research received no specific grant. Authors’ contributionTashiro and Kishimoto: Conceptualization, Methodology, Validation, Formal analysis, Investigation, Resources, Data Curation, Writing—Original Draft, Writing—Review and Editing, Visualization. Kushida, Fukushima, Yoshimura, Sugi, Tamazawa, Shimizu (Eisei), and Matsumoto: Conceptualization, Methodology, Validation, Investigation, Resources, Data Curation, Visualization. Miyahara, Iseri, and Shimizu (Miki): Conceptualization, Methodology, Validation, Formal analysis, Investigation, Resources, Data Curation, Writing—Review and Editing, Visualization, Supervision, Project administration. Data availabilityAll data are available in the published manuscript. ReferencesAndreis, M.E., Polito, U., Veronesi, M.C., Faustini, M., Di Giancamillo, M. and Modina, S.C. 2018. Novel contributions in canine craniometry: anatomic and radiographic measurements in newborn puppies. PLoS One 13(5), e0196959. Auger, M., Alexander, K., Beauchamp, G. and Dunn, M. 2016. Use of CT to evaluate and compare intranasal features in brachycephalic and normocephalic dogs. J. Small. Anim. Pract. 57(10), 529–536. Coppola, D.M., Craven, B.A., Seeger, J. and Weiler, E. 2014. The effects of naris occlusion on mouse nasal turbinate development. J. Exp. Biol. 217(12), 2044–2052. Craven, B.A., Neuberger, T., Paterson, E.G., Webb, A.G., Josephson, E.M., Morrison, E.E. and Settles, G.S. 2007. Reconstruction and morphometric analysis of the nasal airway of the dog (Canis familiaris) and implications regarding olfactory airflow. Anat. Rec. 290(11), 1325–1340. Craven, B.A., Paterson, E.G. and Settles, G.S. 2010. The fluid dynamics of canine olfaction: unique nasal airflow patterns as an explanation of macrosmia. J. R. Soc. Interface. 7(47), 933–943. Friling, L., Nyman, H.T. and Johnson, V. 2014. Asymmetric nasal mucosal thickening in healthy dogs consistent with the nasal cycle as demonstrated by MRI and CT. Vet. Radiol. Ultrasound. 55(2), 159–165. Koch, D., Wiestner, T., Balli, A., Montavon, P., Michel, E., Scharf, G. and Arnold, S. 2012. Proposal for a new radiological index to determine skull conformation in the dog. Schweiz. Arch. Tierheilkd. 154(5), 217–220. Kuehn, N.F. 2006. Nasal computed tomography. Clin. Tech. Small Anim. Pract. 21(2), 55–59. Lawson, M.J., Craven, B.A., Paterson, E.G. and Settles, G.S. 2012. A computational study of odorant transport and deposition in the canine nasal cavity: implications for olfaction. Chem. Senses. 37(6), 553–566. Lefebvre, J., Kuehn, N.F. and Wortinger, A. 2005. Computed tomography as an aid in the diagnosis of chronic nasal disease in dogs. J. Small Anim. Pract. 46(6), 280–285. Loftus, P.A., Wise, S.K., Nieto, D., Panella, N., Aiken, A. and DelGaudio, J.M. 2016. Intranasal volume increases with age: computed tomography volumetric analysis in adults. Laryngoscope 126(10), 2212–2215. Miles, S. and Schwarz, T. 2020. Canine nasal septum deviation can be a normal variation and correlates with increasing skull indices. Vet. Radiol. Ultrasound. 61(3), 279–284. Saunders, J.H., Van Bree, H., Gielen, I. and De Rooster, H. 2003. Diagnostic value of computed tomography in dogs with chronic nasal disease. Vet. Radiol. Ultrasound. 44, 409–413. Van Valkenburgh, B., Pang, B., Bird, D., Curtis, A., Yee, K., Wysocki, C. and Craven, B.A. 2014. Respiratory and olfactory turbinals in feliform and caniform carnivorans: the influence of snout length. Anat. Rec. 297(11), 2065–2079. Wagner, F. and Ruf, I. 2021. “Forever young”-Postnatal growth inhibition of the turbinal skeleton in brachycephalic dog breeds (Canis lupus familiaris). Anat. Rec. 304(1), 154–189. | ||

| How to Cite this Article |
| Pubmed Style Tashiro K, Kushida K, Miyahara S, Yoshimura A, Sugi S, Tamazawa M, Shimizu E, Matsumoto M, Iseri T, Shimizu M, Fukushima R, Kishimoto M. Differences in normal nasal computed tomography findings in different dog breeds. Open Vet. J.. 2024; 14(5): 1182-1190. doi:10.5455/OVJ.2024.v14.i5.13 Web Style Tashiro K, Kushida K, Miyahara S, Yoshimura A, Sugi S, Tamazawa M, Shimizu E, Matsumoto M, Iseri T, Shimizu M, Fukushima R, Kishimoto M. Differences in normal nasal computed tomography findings in different dog breeds. https://www.openveterinaryjournal.com/?mno=175496 [Access: June 26, 2026]. doi:10.5455/OVJ.2024.v14.i5.13 AMA (American Medical Association) Style Tashiro K, Kushida K, Miyahara S, Yoshimura A, Sugi S, Tamazawa M, Shimizu E, Matsumoto M, Iseri T, Shimizu M, Fukushima R, Kishimoto M. Differences in normal nasal computed tomography findings in different dog breeds. Open Vet. J.. 2024; 14(5): 1182-1190. doi:10.5455/OVJ.2024.v14.i5.13 Vancouver/ICMJE Style Tashiro K, Kushida K, Miyahara S, Yoshimura A, Sugi S, Tamazawa M, Shimizu E, Matsumoto M, Iseri T, Shimizu M, Fukushima R, Kishimoto M. Differences in normal nasal computed tomography findings in different dog breeds. Open Vet. J.. (2024), [cited June 26, 2026]; 14(5): 1182-1190. doi:10.5455/OVJ.2024.v14.i5.13 Harvard Style Tashiro, K., Kushida, . K., Miyahara, . S., Yoshimura, . A., Sugi, . S., Tamazawa, . M., Shimizu, . E., Matsumoto, . M., Iseri, . T., Shimizu, . M., Fukushima, . R. & Kishimoto, . M. (2024) Differences in normal nasal computed tomography findings in different dog breeds. Open Vet. J., 14 (5), 1182-1190. doi:10.5455/OVJ.2024.v14.i5.13 Turabian Style Tashiro, Kodai, Kazuya Kushida, Shunsuke Miyahara, Aritada Yoshimura, Shoma Sugi, Mizuki Tamazawa, Eisei Shimizu, Miu Matsumoto, Toshie Iseri, Miki Shimizu, Ryuji Fukushima, and Miori Kishimoto. 2024. Differences in normal nasal computed tomography findings in different dog breeds. Open Veterinary Journal, 14 (5), 1182-1190. doi:10.5455/OVJ.2024.v14.i5.13 Chicago Style Tashiro, Kodai, Kazuya Kushida, Shunsuke Miyahara, Aritada Yoshimura, Shoma Sugi, Mizuki Tamazawa, Eisei Shimizu, Miu Matsumoto, Toshie Iseri, Miki Shimizu, Ryuji Fukushima, and Miori Kishimoto. "Differences in normal nasal computed tomography findings in different dog breeds." Open Veterinary Journal 14 (2024), 1182-1190. doi:10.5455/OVJ.2024.v14.i5.13 MLA (The Modern Language Association) Style Tashiro, Kodai, Kazuya Kushida, Shunsuke Miyahara, Aritada Yoshimura, Shoma Sugi, Mizuki Tamazawa, Eisei Shimizu, Miu Matsumoto, Toshie Iseri, Miki Shimizu, Ryuji Fukushima, and Miori Kishimoto. "Differences in normal nasal computed tomography findings in different dog breeds." Open Veterinary Journal 14.5 (2024), 1182-1190. Print. doi:10.5455/OVJ.2024.v14.i5.13 APA (American Psychological Association) Style Tashiro, K., Kushida, . K., Miyahara, . S., Yoshimura, . A., Sugi, . S., Tamazawa, . M., Shimizu, . E., Matsumoto, . M., Iseri, . T., Shimizu, . M., Fukushima, . R. & Kishimoto, . M. (2024) Differences in normal nasal computed tomography findings in different dog breeds. Open Veterinary Journal, 14 (5), 1182-1190. doi:10.5455/OVJ.2024.v14.i5.13 |

